Browse categories
Explore
Fiverr Pro
English
$
USD
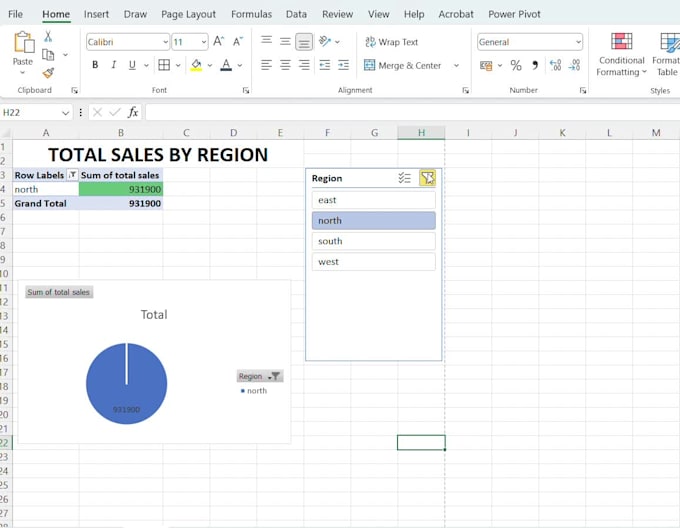
Are you looking for a powerful and visually appealing Sales Dashboard in Excel that helps you monitor your sales performance, identify trends, and make data-driven decisions?
You're in the right place!
I will design a fully interactive and automated Sales Dashboard tailored to your business needs using charts, slicers, pivot tables, and professional formatting.
---
What Youll Get:
Dynamic & interactive Excel Sales Dashboard
Visual charts (bar, line, pie, etc.)
Monthly/quarterly/yearly sales summary
Region-wise, product-wise, or team-wise breakdown
Slicers for easy filtering and data analysis
User-friendly and clean design
Automated calculations and formatting
---
I Work With:
Raw sales data
CSV, Excel, or Google Sheets files
E-commerce/retail/wholesale businesses
Sales reports and team performance tracking
---
100% Confidentiality | 100% Satisfaction Guaranteed
Lets transform your raw sales data into insights that drive results.
Place your order now or message me if you have any custom requirements!


Technology:
Excel
•
Other
Expertise:
Business Insights
•
Trends
•
Statistics
Programming language:
NoSQL
Please upload your sales data file(excel/csv format).
file upload
What specific KPIs or metrics do you want to track in the dashboard?
eg., by product or region,salesperson,time period free text
how would you like your data to be categorized or filtered?
eg., by product or region
do you want the dashboards to be printed or exported as pdf?
yes,I want it to be exportable for pdf as reports