Browse categories
Explore
Fiverr Pro
English
$
USD


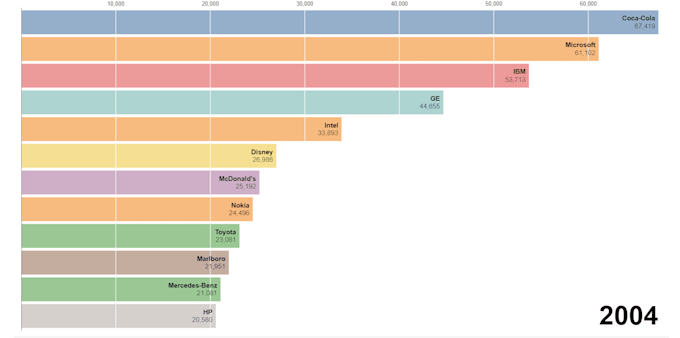
Unlock the Power of Data with Custom D3.js Visualizations!!!
Hi, I'm a Senior Software Developer with years of experience building powerful, interactive, and scalable data visualizations using D3.js. Whether you need a one-of-a-kind chart or a full dashboard, I specialize in transforming raw data into dynamic, visually stunning, and actionable insights.
What I Offer:
Use Cases:
Why Choose Me?
Lets create something awesome with code
Languages
What data formats do you accept?
I work with a wide range of formats including JSON, CSV, Excel, and API endpoints. If you’re unsure, just send what you have — I’ll take care of the rest.
Can you integrate D3.js visualizations into my existing website or app?
Absolutely. I can seamlessly embed the D3.js charts into websites or frontend frameworks like React, Vue, or Angular.
Do I need to provide the design or chart type?
Not at all! Just share your data and goals — I’ll recommend the most effective chart types and visual structures based on best UX and storytelling practices.
Will the visualizations be mobile responsive?
Yes! All my visualizations are optimized for responsiveness unless requested otherwise.
Can you connect the charts to live data or APIs?
Definitely. I can fetch and bind real-time or dynamic data using REST APIs or WebSocket feeds.
How do you handle large or complex datasets?
I use performance optimization techniques like virtual DOM updates, throttling, and chunking to ensure smooth interactivity even with large datasets.
Can I request revisions after delivery?
Yes, all packages include revisions. I also offer extended support if you want post-delivery maintenance or tweaks.
Will I get the source code and documentation?
Yes. You’ll receive clean, well-commented code along with documentation or usage notes if needed.
What if I don’t know exactly what I need?
No problem! Just message me before ordering — I’ll guide you and even suggest ideas to visualize your data more effectively.