Browse categories
Explore
Fiverr Pro
English
$
USD


Raw data is useless until someone turns it into something you can look at.
Send me your spreadsheet, CSV, or database export. I'll clean it up, find what it's actually saying, and turn it into charts that make the point obvious.
WHAT I DO
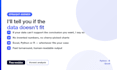
Clean: deduplicate, fix formats, handle missing values, standardize categories
Analyze: what's actually happening in this data, what's driving it
Visualize: bar, line, pie, scatter, heatmap, radar designed to be read, not just displayed
Deliver publication-quality images (PNG / PDF / SVG) plus the cleaned data
Excel, Python, or R depending on what fits
WHAT YOU GET
Visualization choice matched to your data and audience not just "one of each chart"
Cleaned source data
A short written read of what the data shows
Honest note: if your data can't support the conclusion you're hoping for, I'll tell you.
Data Analysis, Python Scraping and SPSS Statistics
Languages
What file formats can you work with?
CSV, XLSX, Google Sheets exports, JSON, and plain text. If you're not sure what you have, send it and I'll tell you whether I can open it.
Can you tell me which chart to use?
Yes - choosing the right chart is part of the work, and I'll explain why I picked it. If you already have one in mind, tell me and I'll make that work instead.
Will I get the source file too?
Basic: chart images (PNG). Standard: images plus the cleaned data file. Premium: everything plus the editable source and a written read of what the data shows.
Can you make the data show a specific result?
No - and I would rather lose the order than misrepresent your data. I'll show you what the data actually says. If it doesn't match what you hoped for, I'll tell you straight and we'll look at what it does support.


