Browse categories
Explore
Fiverr Pro
English
$
USD


Are you a researcher, master's student, or PhD candidate struggling to get your data ready for publication? High-impact journals demand flawless, high-resolution figures, and standard spreadsheet software often falls short.
I specialize in translating raw biological, ecological, and fisheries data into professional, publication-grade visualizations.
What I Offer:
Custom graphs utilizing R (specifically ggplot2) to clearly communicate complex datasets.
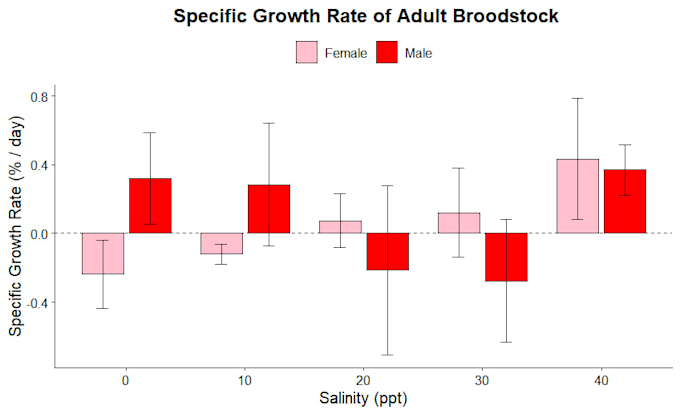
Conducting precise statistical tests (ANOVA, correlations) and plotting the exact findings with significance markers.
Assembling cohesive, multi-graph plates (using tools like patchwork) that look clean and professional.
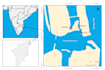
Creating highly detailed study area maps, complete with graticules, scale bars, and interpolated environmental data layouts using QGIS.
Post-processing and photography or specimen images into standard scientific plates using professional image editing software.
I understand the rigorous peer-review process from the inside. I know exactly what formatting, DPI, and aesthetic standards are expected by top-tier publishers. You will receive precise, aesthetically pleasing, and scientifically accurate figures.
Please inform the freelancer of any preferences or concerns regarding the use of AI tools in the completion and/or delivery of your order.
Languages