Browse categories
Explore
Fiverr Pro
English
$
USD
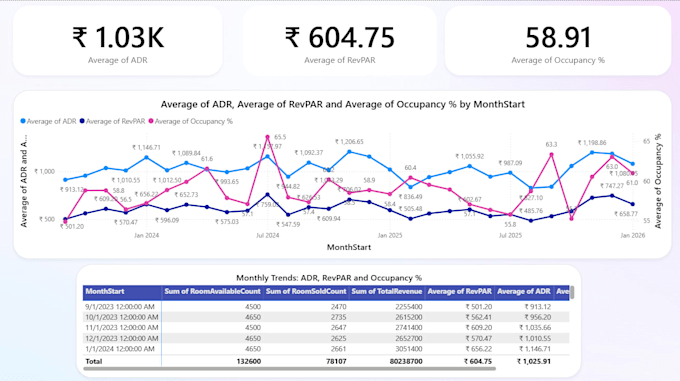
Data Analyst specializing in SQL, Python, Power BI, and Excel
Are you sitting on data that should be telling you a story, but right now it's just rows and columns in a spreadsheet?
I'll turn your raw data into a clean, interactive Power BI dashboard that helps you spot trends, track performance, and make faster decisions without needing to dig through spreadsheets manually.
What I can build for you:
Interactive dashboards with slicers, filters, and drill-through pages
DAX measures for calculations like growth %, running totals, YoY comparisons
Data cleaning and transformation in Power Query
SQL queries to pull and prep data from databases
Excel dashboards with pivot tables and dynamic charts (if you prefer Excel over Power BI)
Tools I work with: Power BI, Excel, SQL, Python (Pandas) for data cleaning when needed.
What I need from you to get started:
Your dataset (Excel, CSV, Google Sheets, or database export)
A short note on what decisions you're trying to make (e.g. "I want to track monthly sales by region" or "I need to see which products are underperforming")
Any brand colors or style preferences (optional)
What you'll get:
A polished, interactive dashboard file
A short written summary of key insights from your data


Do you need my actual business data, or can I use sample data?
You can share real data (I treat it confidentially) or sample/dummy data — whatever you're comfortable with
What if I don't have Power BI?
No problem, I can deliver the file and walk you through opening it, or build it in Excel instead if you prefer.
Can you connect to my live database?
Yes, for Standard/Premium packages I can set up SQL connections if you provide access details.
What if my data is messy or incomplete?
That's fine — data cleaning is part of the process. Just let me know roughly what shape it's in when you message me.