Browse categories
Explore
Fiverr Pro
English
$
USD
Python ML Developer Dataset and GUI Apps
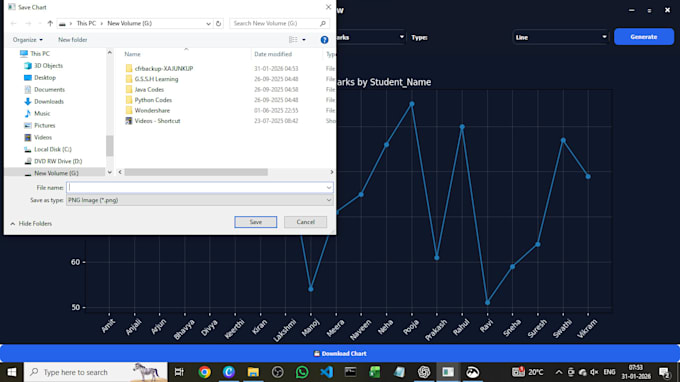
Python Dashboard Development | Interactive Data Visualization
I will create a custom Python dashboard to visualize and analyze your data clearly and professionally.
Interactive dashboards
Charts, graphs & KPIs
CSV / Excel / SQL data support
Clean & user-friendly UI
Dark or light theme
Streamlit / Dash based dashboards
Fully customizable layout
Perfect for:
Business analytics
Student performance
Sales & reports
ML model monitoring
I focus on clean code, clear visuals, and fast delivery.
Please contact me before ordering to discuss your requirements.
Lets turn your data into insights!


Expertise:
Image processing
•
Predictive analysis
Programming language:
Python
Frameworks:
Scikit-learn
•
Panda
APIs:
Other
Tools:
Excel
What do you need to start the dashboard?
I need your data (CSV/Excel/Database), dashboard requirements, and preferred charts or layout.
Which Python tools do you use?
I use Python with Streamlit or Dash, along with Pandas, Plotly, and Matplotlib.
Can you customize the dashboard design?
Yes, the dashboard is fully customizable (colors, theme, charts, layout).
Do you support CSV, Excel, or SQL data?
Yes, I support CSV, Excel, and SQL databases.
Will you provide source code?
Yes, complete and clean Python source code will be provided.
Can you add new features after delivery?
Yes, minor changes are supported. For major updates, we can discuss an extra order.