Browse categories
Explore
Fiverr Pro
English
$
USD
Do you have messy or unorganized data that needs to be turned into clear insights?
You're in the right place!
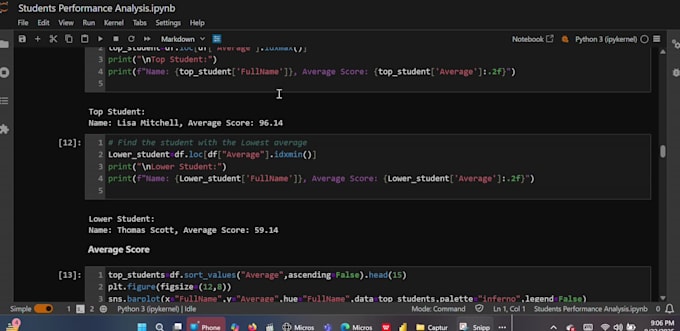
I will clean, analyze, and visualize your data using Python, Excel, or Power BI, helping you make smart, data-driven decisions.
Whether its business sales, academic surveys, or research data Ill handle everything from removing duplicates and fixing errors to creating meaningful charts and dashboards that tell a story.
What I Offer
️ Tools
Python, Pandas, NumPy, Matplotlib, Seaborn, Power BI, Excel
Deliverables are clear, organized, and ready to present perfect for reports, projects, or business use.
Lets transform your data into insights that matter!


What type of data can you work with?
I can handle any dataset — Excel files, CSV, Google Sheets, survey results, business sales, or research data.
Can you build dashboards in Power BI or Excel?
Yes! I can create professional and interactive dashboards in Power BI or Excel to visualize key metrics.
What if my data is very messy or incomplete?
No worries! I’ll clean, format, and organize your data — and let you know if any major issues need your input.
Can you add insights or recommendations from the analysis?
Absolutely! I’ll include key insights and summaries explaining what the data reveals.
Do you handle confidential data?
Yes. Your data is 100% secure and will never be shared with anyone.