Browse categories
Explore
Fiverr Pro
English
$
USD

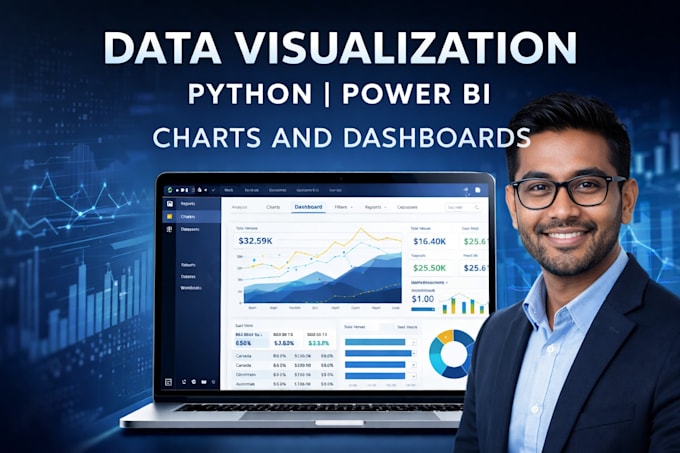
I will help you transform your raw data into clear and professional charts and graphs that are easy to understand and visually appealing. (Basic Visualizations and Dashboarding)
I can create visualizations such as:
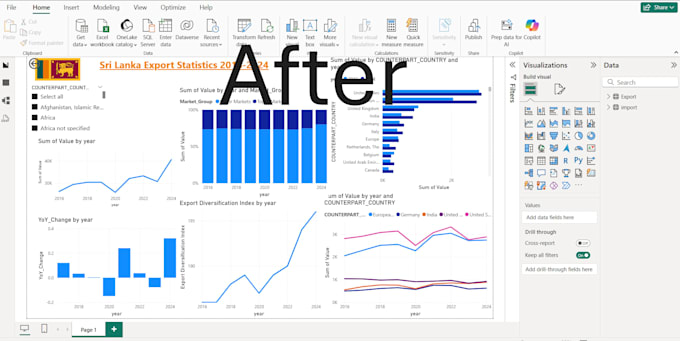
Bar charts
Line charts
Pie charts
Histograms
Scatter plots
These charts can be created using tools like Excel, Python, or Power BI, depending on your needs.
What you will get:
Clean and professional data visualizations
Well-labeled charts for better understanding
High-quality image or file delivery
Fast and reliable communication
Please message me before placing an order if you have a custom request.
Thank you!
Business Data Analytics Excel Data Analysis and Visualization Power BI
Languages