Browse categories
English
$
USD
Connect to your AI

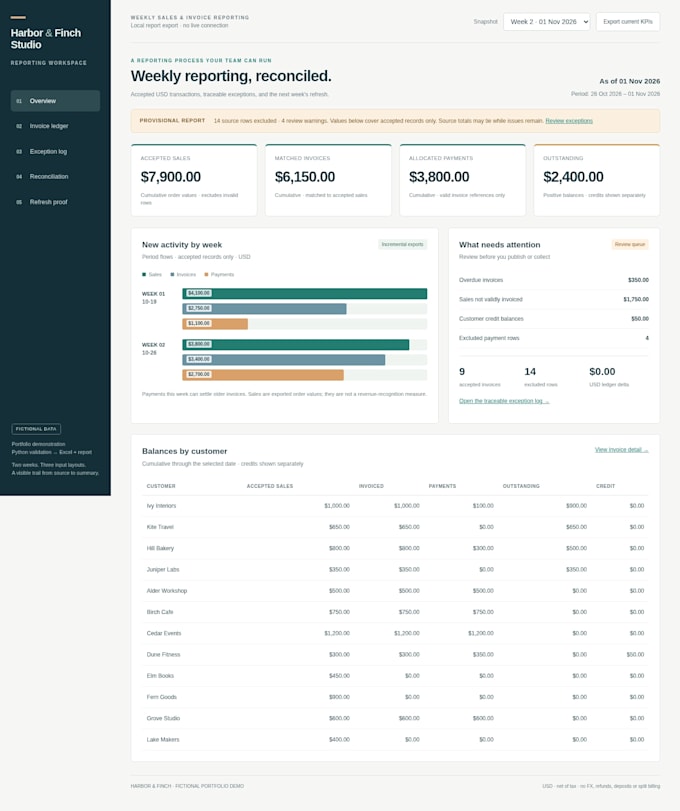

Turn your business data into an interactive Python dashboard. I build Streamlit dashboards for sales, expenses, inventory or operational KPIs, using agreed CSV exports.
BASIC: 1 page, 1 source, 5 KPIs, filters and local setup.
STANDARD: 3 pages, 2 sources, 10 KPIs, filters and CSV export.
PREMIUM: 5 pages, 3 sources, 15 KPIs, export and setup on one agreed hosting account.
All packages include source code, input validation, setup instructions and checks against agreed totals. Each source is one documented CSV layout; combined input limit is 10000 rows per refresh. Upload-based refresh is included.
Message me with anonymized samples, KPI definitions and desired views before ordering. Hosting, subscriptions and API fees are paid by the buyer. API integrations, login systems, write-back forms and real-time streaming require a separate quote.
Revisions cover agreed requirements. A 14-day bug-fix period covers reproducible defects in delivered scope; new features and ongoing maintenance are separate. Demo images use fictional data and do not imply client results.
Excel reporting automation, Python, VBA and Power BI
Languages
