Browse categories
Explore
Fiverr Pro
English
$
USD


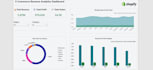

Struggling to understand what's actually driving your Shopify store's revenue? I will build a clean, automated Power BI dashboard that connects to your Shopify data and shows your sales trends, top products, and customer behavior at a glance.
What you get:
Tools used: Power BI, Excel, SQL
Why work with me: I focus on dashboards that help you make faster decisions, not just charts that look nice. Once you order, share your Shopify data export (or store access if needed) along with what matters most to your business, and I'll build the dashboard around your actual goals.
Feel free to message me before ordering if you want to discuss your specific requirements.
Data Analyst, Power BI, Excel, SQL, Python
Languages
What data sources can you connect to the Shopify dashboard?
I can connect your Power BI Shopify dashboard to Shopify API, Excel files, CSVs, or SQL databases.
Will my e-commerce analytics dashboard update automatically?
Yes, once the data gateway is configured, your sales analytics metrics will refresh automatically.
Do I need to share my Shopify store login credentials?
No, you can share the data via Excel/CSV exports or give restricted staff access for data connection safety.
What metrics will I see?
Revenue, orders, average order value, refunds, top products, and sales trends over time — customizable based on your needs.
How many revisions are included?
Standard and Premium include unlimited revisions; Basic includes 2.


