Browse categories
Explore
Fiverr Pro
English
$
USD
Video editor, motion graphics, finance
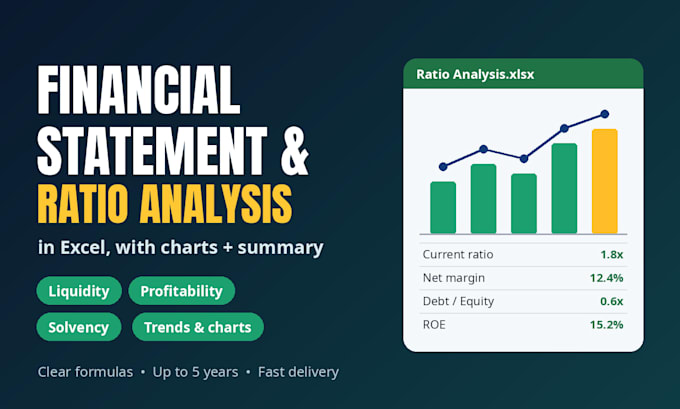
Need a clear analysis of a company's financial statements? I'm a commerce student and I build neat, formula-based Excel workbooks that turn balance sheets and income statements into ratios, trends and charts you can actually read.
What you get:
- Key ratios: liquidity (current, quick), profitability (margins, ROA, ROE), solvency (debt/equity, interest cover) and efficiency (turnover, days)
- Year-on-year trends and common-size statements
- Clean charts and a dashboard sheet
- A short written summary of what the numbers show (Standard and Premium)
- All formulas visible, so you can check and reuse them
Good for college projects, assignments, business reports and comparing two companies.
Send me the annual reports or financial statements (PDF or Excel), or the name of a listed company and the years you need. I'll ask you if anything is unclear instead of guessing.
Please note: this is analysis of past figures only. I don't give investment advice, buy/sell tips, tax filing or audit services.
Visualization Tools:
Microsoft Excel
•
Python
Type of model:
Other
Target country:
Worldwide
What do I need to send?
The financial statements (annual report PDF or Excel), or the name of a listed company and the years. If you need specific ratios, list them.
Can I see the formulas?
Yes. Every ratio is calculated with visible Excel formulas, so you can check and reuse them. It also opens in Google Sheets.
Can you compare two companies?
Yes, the Premium package covers 2 companies side by side, or up to 5 years of one company.
Do you give investment advice?
No. I analyse historical financial statements only. No buy/sell recommendations, tax filing or audit.
Can you follow my college format?
Yes. Send your format or the list of ratios your teacher asked for and I'll follow it.
