Browse categories
English
$
USD
Connect to your AI

Level 2

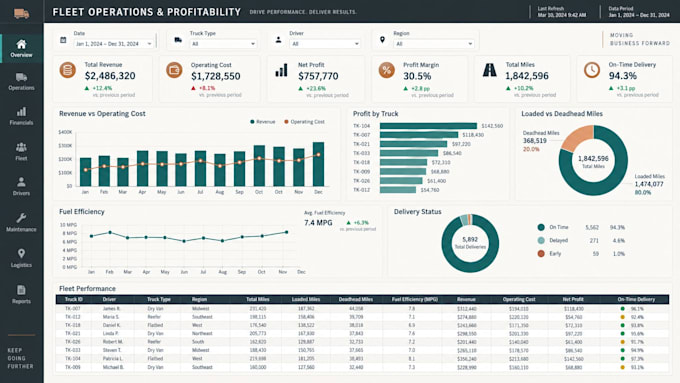
Have data in Excel, CSV, Google Sheets or SQL but cant see what its telling you?
I'll turn it into a clean, interactive Power BI dashboard that shows your KPIs, trends and problem areas at a glance. With 8 years of experience, I understand cost, progress and performance data, not just charts.
What you get:
Dashboards I build:
Every dashboard is built around your real business questions and is easy to refresh when new data comes in.
Not sure which package fits? Send me a sample of your data and I'll recommend the right one.
Excel, Google sheet Workflow Automation and Dynamic Dashboard Design
Level 2
Languages

Dynasafe

Elleebana

Harmony Gold Mining Company Limited

VicTan Connect Non-Emergency Medical Transportation
| (1) | ||
| (0) | ||
| (0) | ||
| (0) | ||
| (0) |

emery__

Grenada
Easy of work can't be understated!
$50
Price
1 day
Duration
| (1) | ||
| (0) | ||
| (0) | ||
| (0) | ||
| (0) |
emery__
Grenada
Easy of work can't be understated!
$50
Price
1 day
Duration