Browse categories
Explore
Fiverr Pro
English
$
USD


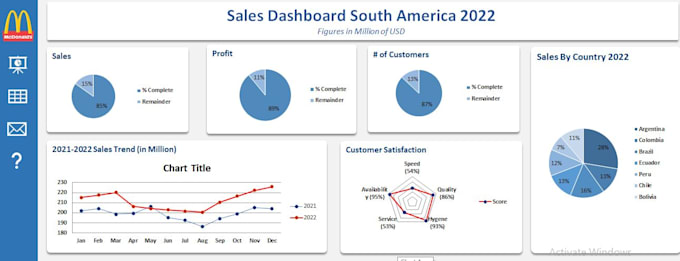
I will provide expert data analysis and create insightful data visualization dashboards using Excel, Power BI, or Python. Whether you need a simple Excel dashboard or a detailed Power BI report, I deliver clear, interactive visuals that help you make data-driven decisions. My services include data cleaning, trend analysis, and custom reports tailored to your business needs. Lets turn your raw data into powerful insights!
Expert Data Insights with SQL Python and Excel
Languages
What types of data formats do you accept?
I can work with most common data formats including Excel files (.xlsx, .csv), Google Sheets, SQL databases, and JSON. If you have a different format, just ask!
Which tools do you use for data analysis and dashboard creation?
I primarily use Excel, Power BI, and Python (with libraries like Pandas and Matplotlib) to clean, analyze, and visualize your data.
Can you handle large datasets?
Yes! I am experienced in working with both small and large datasets. For extremely large datasets, we can discuss the best approach to ensure smooth processing.
Will I be able to update the dashboard myself later?
Absolutely! I provide dashboards that are user-friendly and easy to update. I can also include simple instructions or offer additional training if needed.
What do you need from me to get started?
Please provide the raw data files, a brief description of your goals, and any specific metrics or visualizations you want in your dashboard.