Browse categories
English
$
USD
Connect to your AI



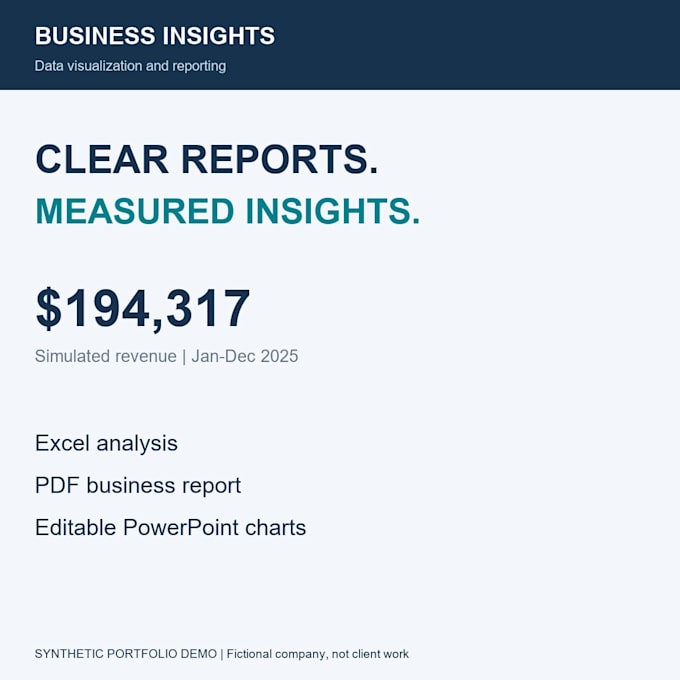
Turn your Excel or CSV data into clear charts and practical business reports.
I help small businesses and professionals understand sales trends, product performance, regional results, channel comparisons, and profitability using agreed metric definitions.
Every package includes charts, graphs, and a concise executive summary.
BASIC: Up to 500 rows, 3 charts, and brief findings in one PDF or Excel report.
STANDARD: Up to 1,500 rows, 6 charts, and 3 to 5 insights in one PDF or Excel report.
PREMIUM: Up to 3,000 rows, 8 charts, a PDF report, and a PowerPoint presentation of up to 6 slides.
Before starting, we confirm your business questions, reporting period, currency, data definitions, and output. Results are checked against the source data, and revisions cover the original agreed scope.
Portfolio examples use synthetic data. Missing financial values are never guessed.
Advanced statistics, forecasts, interactive dashboards, extensive data cleaning, and financial advice are outside these packages.
Please contact me before ordering if your data or requirements are complex.
Back Office Operational
Languages
What file formats do you accept?
I accept structured XLSX and UTF-8 CSV files. Please contact me before ordering if the data is split across files or has an unusual structure. PDF extraction and damaged-file recovery are not included.
How large can my dataset be?
Basic supports up to 500 total rows, Standard up to 1,500, and Premium up to 3,000, within the stated column/file limits. Complexity matters as well as size; please confirm complex requirements before ordering.
Which report formats can I receive?
Basic offers one agreed PDF, Excel, or PowerPoint output. Standard offers one PDF or Excel report. Premium includes a PDF report and PowerPoint presentation. Page, sheet, slide, and chart limits are specified in each package.
Is data cleaning included?
Basic preparation includes agreed whitespace/category standardization and exact duplicate checks. Extensive cleaning, fuzzy matching, or extraction requires a separate scope. I preserve the original source.
How do you handle missing or inconsistent data?
I flag unclear values and ask for a reliable rule or source. I do not fabricate financial values. Any exclusions and their effect on calculations are documented before conclusions are drawn.
What does a revision include?
A revision corrects work against the original agreed questions, calculations, chart styling, and report requirements. New data, reporting periods, metrics, or major layout changes require a separate agreement.
Will my data remain confidential?
I use buyer files only for the agreed work and do not publish them or upload them to external AI services without appropriate authorization. Please remove unnecessary sensitive information before sharing.
Is your portfolio real client work?
This portfolio uses synthetic data from a fictional business. It demonstrates analysis and reporting skills and does not represent a client engagement or commercial results.
Are statistical modeling or forecasts included?
No. These packages focus on descriptive analysis and reporting. Advanced statistical testing, predictive models, causal analysis, or forecasting require separate assessment and agreement.
Does profit mean net profit?
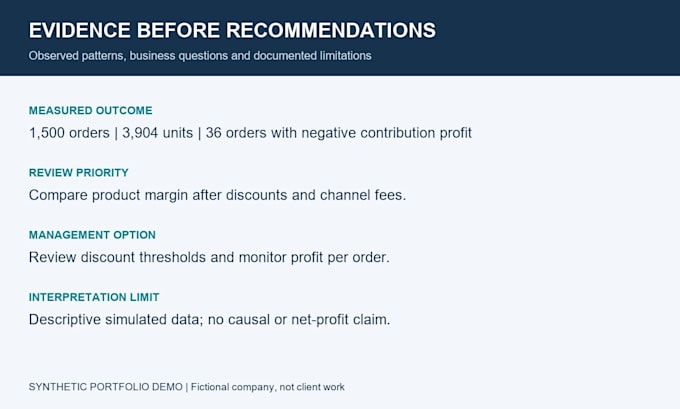
We confirm the definition first. In the demo, contribution profit equals discounted revenue minus product cost and simulated channel fees. It excludes overhead, payroll, tax, and returns. Your report will use the agreed cost scope.