Browse categories
Explore
Fiverr Pro
English
$
USD
Economist and Quantitative Data Analyst
Have a dataset but need clear, reliable analysis and meaningful results?
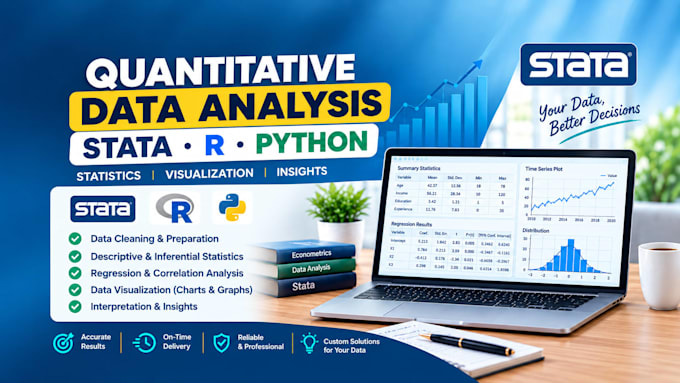
I provide quantitative data analysis and visualization using Stata, R, and Python. I can help clean and organize your data, perform statistical analysis, create clear visualizations, and explain the results in an understandable way.
I can help with:
You will receive organized analysis, clear results, relevant tables or visualizations, and a concise interpretation tailored to your objective.
I work with cross-sectional, panel, time-series, and other quantitative datasets.
Please provide your dataset and describe what you want to understand from it. If you are unsure which analysis is appropriate, tell me your objective and I can assess the suitable approach before proceeding.

Q: What types of data analysis do you provide?
I provide descriptive and quantitative analysis, hypothesis testing, correlation analysis, regression analysis, statistical diagnostics, exploratory analysis, time-series analysis, forecasting, visualization, and results interpretation.
Q: Which software do you use?
I work with Stata, R, and Python depending on the requirements of the project and dataset.
Q: Can you analyze an uncleaned dataset?
Yes. I can clean, organize, transform, and prepare the dataset before performing the requested analysis.
Q: Can you choose the appropriate analysis method?
Yes. If you are unsure which statistical method is appropriate, provide your dataset and explain your objective. I can assess the appropriate approach before proceeding.
Q: Will you explain the results?
Yes. Packages include a concise interpretation of the main results, with tables or visualizations where appropriate.
Q: Can you create charts and graphs?
Yes. I can create clear statistical visualizations and charts appropriate for your dataset and analysis.
| (1) | ||
| (0) | ||
| (0) | ||
| (0) | ||
| (0) |

waleedhassan719

Pakistan
he was very professional and perfect in terms of delivery communication and proficiency ... i will definitely recommend and contact him again in future for my thesis
$50
Price
3 days
Duration
| (1) | ||
| (0) | ||
| (0) | ||
| (0) | ||
| (0) |
waleedhassan719
Pakistan
he was very professional and perfect in terms of delivery communication and proficiency ... i will definitely recommend and contact him again in future for my thesis
$50
Price
3 days
Duration