Browse categories
Explore
Fiverr Pro
English
$
USD

Hi!
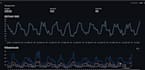
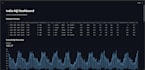
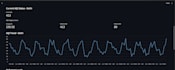
I will build interactive GIS and data analytics dashboards using Python, Streamlit, and geospatial visualization tools.
I can help you with:
Interactive Streamlit dashboards
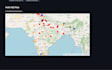
GIS & geospatial visualization
AQI and environmental dashboards
Climate and pollution analytics
KPI dashboards and charts
Time-series analysis
CSV/Excel data visualization
Interactive Folium maps
Heatmaps and point maps
Dashboard filtering and analytics
Tools & Technologies:
Python
Streamlit
Pandas
Folium
Matplotlib
Plotly
QGIS
What you will receive:
Professional dashboard UI
Interactive visualizations
Clean and organized code
Fast communication
Source files included
Perfect for:
Students
Researchers
GIS projects
Environmental analysis
Data analytics projects
Academic and portfolio work
Please contact me before placing an order to discuss project requirements.
I will create professional GIS maps using QGIS
Languages
What data formats do you support?
CSV, Excel, GeoJSON, Shapefile, and spatial datasets.
Which tools do you use?
Python, Streamlit, Folium, Pandas, Matplotlib, and QGIS.
Can you create custom environmental dashboards?
Yes, including AQI, pollution, climate, deforestation, and heatmap projects.
Do you provide source code?
Yes.


