Browse categories
Explore
Fiverr Pro
English
$
USD



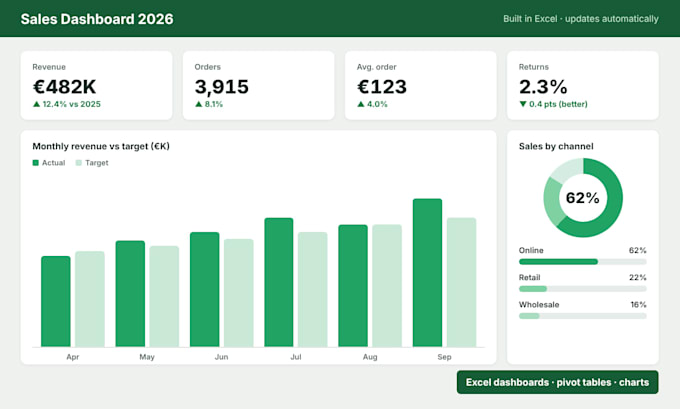
Have a lot of data in Excel but no clear picture of what is going on? I'll turn your raw data into a clean, professional dashboard you can understand at a glance.
I'm a mechanical engineer finishing a master's in industrial engineering. I work with data, KPIs and reports every day, and I focus on dashboards that are clear, easy to update and actually useful for decisions.
What you get:
Great for: sales, inventory, production, budgets, project tracking and personal finance.
Please message me before ordering with a short description of your data (or a sample with fake data), and I'll recommend the right package.
Mechanical engineer, Excel automation and data solutions
Languages
What do you need from me?
Your Excel or CSV file (real or with fake data) and a short list of the KPIs or questions the dashboard should answer. If you're not sure, I'll suggest the key indicators.
Will the dashboard update with new data?
Yes. I build it with tables and pivot tables, so when you add new rows and refresh, the charts and KPIs update automatically.
Do I need Power BI or special software?
No. The dashboard is built in Microsoft Excel, so you only need Excel (2016 or newer, or Microsoft 365).