Browse categories
Explore
Fiverr Pro
English
$
USD


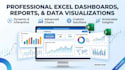
Do you have Excel data but need a clear and professional way to understand and present it?
I will create an organized Excel dashboard, report, or data visualization that helps turn your spreadsheet data into easy-to-understand information.
I can create:
Excel dashboards
Interactive reports
Charts and graphs
Summary tables
KPI reports
Pivot tables
Data summaries
Performance reports
Professional spreadsheet layouts
Basic data visualization
I can work with sales data, financial records, inventory, customer information, marketing data, business performance, and other structured datasets.
I will organize your information into a clean and practical Excel report based on your requirements. Where appropriate, I can use formulas, PivotTables, charts, filters, and dashboard elements to make the information easier to analyze.
Please provide your dataset and explain what you want the dashboard or report to show. If you have an example or preferred design, you can include that too.
Let's turn your Excel data into a clear and useful report.
Excel Expert Data Cleaning, Formatting , Dashboards
Languages
