Browse categories
Explore
Fiverr Pro
English
$
USD

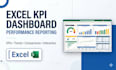


Need a clear way to track KPIs and understand business performance?
I will turn your Excel data into a professional KPI dashboard that makes trends, comparisons, and key metrics easy to understand.
Your dashboard may include:
PACKAGE SCOPE:
Basic: Up to 4 KPIs and 3 charts
A simple 1-page dashboard using clean, organized data you provide.
Standard: Up to 8 KPIs and 5 charts
An interactive dashboard with filters, comparisons, and performance tracking.
Premium: Up to 12 KPIs and 8 charts
An advanced interactive dashboard with customized KPI and performance reporting.
If your data requires significant cleaning, complex calculations, multiple dashboards, or custom requirements, please message me before ordering.
My focus is on accurate, practical Excel dashboards that make your data easier to understand and use.
Data Analyst specializing in Excel SQL Python and Automation
Languages
What data do you need to build my dashboard?
Please provide your Excel data and explain what you want to track or understand. Clean, organized data is required for Basic. I can review more complex data before you order.
What is a KPI?
A KPI is a Key Performance Indicator, such as revenue, sales, quality score, productivity, conversion rate, or another metric used to measure performance.
Can you clean my data before building the dashboard?
Light preparation may be included when needed. If your data requires significant cleaning, validation, restructuring, or merging, please contact me before ordering.
Can you make the Excel dashboard interactive?
Yes. Standard and Premium can include Excel filters, slicers, PivotTables, PivotCharts, and other interactive elements when appropriate.
What are the package limits?
Basic includes up to 4 KPIs and 3 charts. Standard includes up to 8 KPIs and 5 charts. Premium includes up to 12 KPIs and 8 charts.
What if I do not know which KPIs or charts I need?
That is okay. Tell me what the business needs to measure or understand, and I can recommend suitable KPIs and visualizations based on the available data.


