Browse categories
Explore
Fiverr Pro
English
$
USD
Data Analyst
Do you have raw, messy, or unorganized data and need clear insights from it?
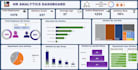
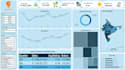
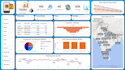
I will clean, analyze, and visualize your data using Microsoft Excel and create a professional, easy-to-understand dashboard or report.
What I can help you with:
What you will receive:
I focus on turning raw data into meaningful information that helps you understand trends, identify important patterns, and track key performance indicators.
Tools I work with:
Whether you have sales data, HR data, marketing data, customer data, or another business dataset, I can help turn it into a clear and useful analysis.
Please contact me before placing an order if you have specific requirements or a large/complex dataset.
Analysis type:
Descriptive Analysis
Expertise:
Business Insights
•
Trends
•
Forecasting
•
Statistics
Technology:
Excel
•
Google Sheets
•
Power BI
•
Power Query
Programming language:
Python
•
SQL
•
DAX
What type of data can you analyze?
I can work with Excel, CSV, and similar structured datasets, including sales, HR, marketing, customer, and business data.
Can you clean and organize my raw data?
Yes. I can clean, format, organize, and prepare your raw data for analysis, including removing duplicates and fixing formatting issues.
Can you create an Excel dashboard?
Yes. Depending on the selected package, I can create PivotTables, Pivot Charts, KPIs, charts, visualizations, and an easy-to-understand Excel dashboard.
Can you provide insights from my data?
Yes. I can identify important trends, patterns, KPIs, and findings from your dataset. The level of insights depends on the package you select.
Can you work with Excel files?
Yes. I can analyze Excel/CSV data and create reports, dashboards, PivotTables, charts, and insights.
What do you need from me to start?
Please provide your Excel or CSV dataset and explain your main requirements or questions. If you have a preferred format, dashboard style, or example, you can share that as well.
Will you provide insights along with the analysis?
Yes. I can provide clear and easy-to-understand insights and findings based on the analysis.
Can I contact you before placing an order?
Absolutely. You can message me with your requirements and dataset details so I can confirm the scope and recommend the appropriate package.


