Browse categories
Explore
Fiverr Pro
English
$
USD

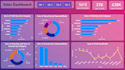
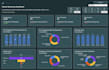


Transform your raw data into clean, compelling, interactive dashboards to derive actionable business insights. I specialize in:
Data Cleaning and Prep: Handle missing values, duplicates, formatting issues, and integrate multiple data sources.
Data Visualization: Build interactive charts, maps, KPIs, time series, and drilldown visuals to tell your data story.
Business Insights: Uncover trends, anomalies, and growth opportunities to support strategic decisions.
Presentation Delivery: Provide polished presentation decks or short walkthrough videos that summarize key insights for stakeholders.
Whether you need a single chart backup or a comprehensive, interactive dashboard, I use the right tool for the job: PowerBI, Tableau, Python (Plotly, Matplotlib, Seaborn), R (ggplot2), and Excel using your data is presented beautifully, accurately, and be business-ready.
Perfect for:
Let me help you turn your data into a strategic asset with clarity, precision, and impact. Ready to get started? Message me now!
Websites, Content, and Data Insights: your one stop digital shop
Languages
What tools do you use for dashbards and data analysis?
I work with PowerBI, Tableau, Python's Plotly, Matplotlib, and Seaborn, R's ggplot2, and Excel. I can also connect to databases like MySQL, PostgreSQL, SQL Server, or data from CSV, Excel, and PDF Files
Can you clean and prepare my data?
Yes. My services include data cleaning, transformation, merging, handling missing values, and prep work, whether in Excel, Python, or R.
Do you create interactive dashboards and embed visuals?
Yes. I deliver interactive dashboards with filters, drill downs, KPIs, maps, animated visuals, and optional web embedding.
How many revisions do I get?
Unlimited revisions. I aim to ensure that you're fully satisfied.
Do you offer fast or express delivery?
Yes. Fast delivery is definitely doable. Express options like 1 to 2 days are available at an additional cost, but things can be discussed according to the case.
Will I receive a PowerPoint or video walkthrough?
Yes. My packages include a polished PowerPoint summary or a screen-recorded video walkthrough, ideal for sharing with stakeholders.
Can you handle multiple data sources and large datasets?
Definitely. I can connect to multiple data sources, perform joins or blends, and can manage large datasets using SQL, Python, or built in tools.
What types of visualizations do you offer?
All standard chart types: bar, line, pie, scatter, heatmap, geomaps, as well as advanced and custom visuals like funnels, waterfalls, gauges, bubbles, tree maps, and word clouds.
Can you teach or explain how the dashboard works?
Yes. In Gig extras, I can record tutorial videos, provide live trainings, or explain dashboard logic.
What if I need updates later on?
Just message me. I'll be happy to provide ongoing support. I also offer optional gig extras for future updates, new data uploads, or additional charts.


