Browse categories
English
$
USD
Connect to your AI



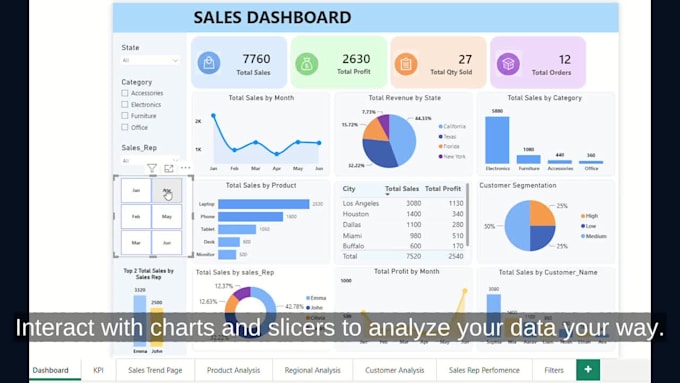
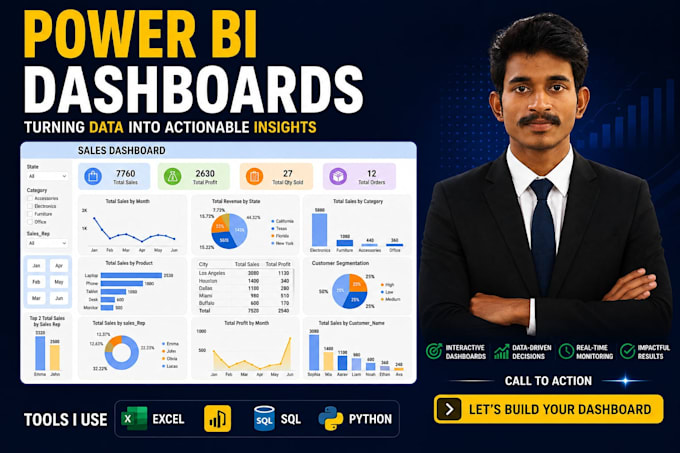
Tired of messy spreadsheets and scattered datasets? I build interactive Power BI dashboards that transform complex raw data into clear, executive-ready business insights.
What You'll Get:
Why Work With Me?
Not sure which package fits your dataset? Send me a message with your raw files or goals, and I'll send you a custom offer!
Power BI Dashboard Developer, Data Analyst, Excel Expert
Languages
My Excel/CSV data is messy. Can you still build the dashboard?
Yes! I perform full data cleaning and transformation using Power Query and Python scripts (Pandas) to clean, restructure, and prepare your data for reporting
Is my business data safe and confidential?
Absolutely 100%. Your data privacy and business information remain completely confidential and secure at all times.
Do I need a paid Power BI license to view the dashboard?
No, you can open and interact with your report for free using Power BI Desktop. A paid license is only needed if you plan to share live web links across an organization
Will the dashboard auto-update when I add new data?
Yes! As long as your new data follows the same format/columns, clicking "Refresh" in Power BI will instantly update all visuals and KPIs