Browse categories
Explore
Fiverr Pro
English
$
USD
Data analysis, visualization, and cleaning are crucial steps in transforming raw data into meaningful insights. Data analysis involves examining, processing, and interpreting data to discover trends, patterns, and relationships. It employs statistical and computational techniques to make informed decisions, enabling businesses and researchers to extract valuable insights from complex datasets.
Data cleaning is the process of identifying and correcting errors, inconsistencies, and missing values in datasets. It ensures accuracy and reliability by removing duplicate records, handling outliers, and standardizing formats. Poor data quality can lead to incorrect conclusions, making data cleaning a fundamental step before analysis.
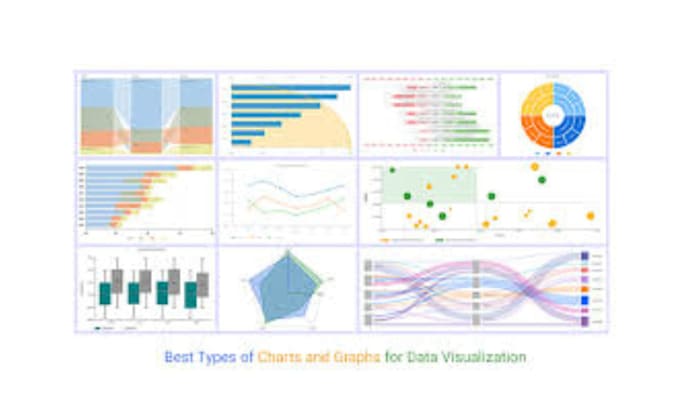
Data visualization presents insights in an easily understandable and visually appealing format. Using graphs, charts, heatmaps, and dashboards, visualization helps to communicate patterns, trends, and anomalies effectively. It allows analysts to quickly identify key findings and share them with stakeholders in a digestible manner. Tools like Tableau, Power BI, and Python libraries such as Matplotlib and Seaborn facilitate advanced visual storytelling.
Together
Programming language:
R
Technology:
SAS
Analysis Type:
Impact Analysis
•
Statistical Analysis
Expertise:
Web analytics