Browse categories
Explore
Fiverr Pro
English
$
USD


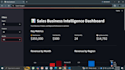
Looking for a Python Streamlit dashboard to visualize your business data? I specialize in building interactive business dashboards using Python, Streamlit, Plotly, Pandas, SQL, and PostgreSQL. Whether your data comes from a CSV, Excel file, or PostgreSQL database, I'll create a clean, responsive dashboard that turns raw data into actionable insights.
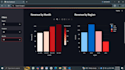
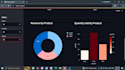
My dashboards include KPI cards, interactive charts, filters, reports, and business analytics for sales, finance, inventory, marketing, customer analytics, and business intelligence. You'll receive a modern dashboard with bar charts, line charts, pie charts, data filtering, and live deployment on Render.
I write clean, scalable Python code and focus on performance, usability, and client satisfaction. Every dashboard is customized to your business needs and designed to help you make data-driven decisions.
Python Automation Developer , AI API Integration , Backend Developer
Languages
What do you need to start the project?
Please share your dataset (CSV, Excel, or PostgreSQL), project requirements, dashboard features, and any design or branding preferences.
Can you connect the dashboard to my PostgreSQL database?
Yes. I can connect your Streamlit dashboard to PostgreSQL and display your data with interactive visualizations.
Do you work with CSV or Excel files?
Yes. I can build dashboards using CSV, Excel, or PostgreSQL data sources.


