Browse categories
Explore
Fiverr Pro
English
$
USD



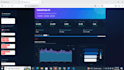
Turn your raw data into a professional and interactive Python dashboard that makes business performance easy to understand.
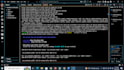
I will build a custom Streamlit dashboard using Python, Pandas, NumPy and Plotly. Your dashboard can include dynamic filters, KPI cards, interactive charts, automated data cleaning and forecasting.
What you can receive:
Professional Streamlit dashboard
Interactive charts and KPI cards
CSV or Excel data integration
Data cleaning and transformation
Sales and business performance analysis
Revenue profit and trend analysis
Dynamic date category and region filters
Forecasting and advanced analytics
Downloadable filtered results
Clean responsive and user friendly design
Well organized Python source code
Installation and running instructions
Why choose me?
I am a professional Data Analyst and Python developer with practical experience in analytics, visualization and business reporting. I focus on accurate results, attractive designs and clear communication.
Please contact me before ordering to discuss your dataset, dashboard requirements and preferred features.
Data Analysis, Science trainer
Languages
1. What information do you need to begin?
Please provide your dataset, required KPIs, preferred charts, filters, colors and any reference dashboard or design.
2. Which data formats do you accept?
I accept CSV and Excel files. Please contact me first if your data comes from a database, API or another source.
3. Which technologies will you use?
I primarily use Python, Streamlit, Pandas, NumPy and Plotly to build interactive analytics dashboards.
4. Can you clean my data before creating the dashboard?
Yes. I can remove duplicates, handle missing values, correct data types and prepare your data for analysis.
6. Can you deploy the dashboard online?
Yes. Online deployment or web embedding can be included in the Premium package or purchased as an additional service.
7. Do you create custom dashboards?
Yes. The dashboard can be customized according to your business requirements, branding, KPIs, charts and preferred color scheme.


