Browse categories
Explore
Fiverr Pro
English
$
USD


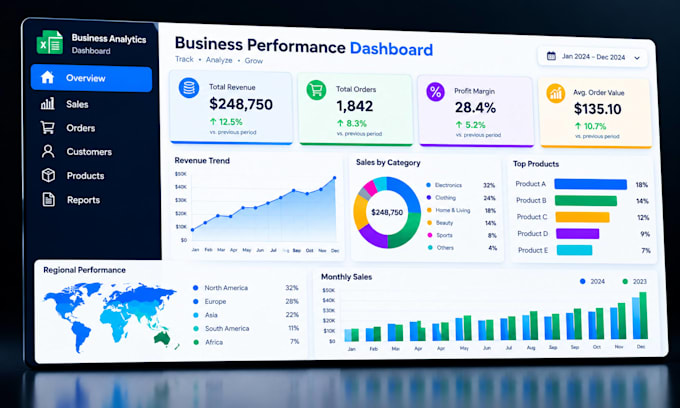
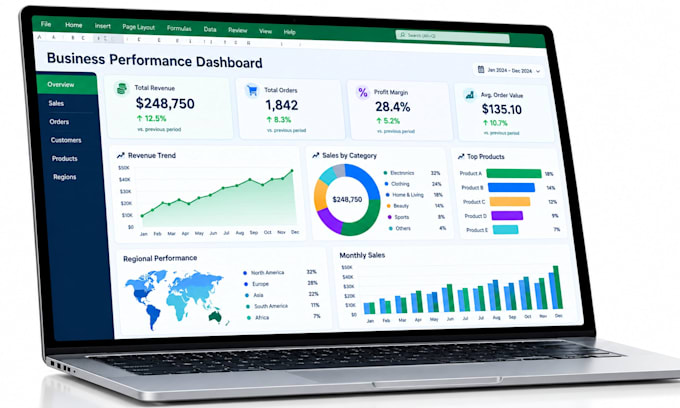
Make your spreadsheets easier to understand, manage, and use for everyday reporting.
I can turn raw or scattered information into a clear working solution that helps you track important figures, review performance, spot trends, and access useful insights without wasting time searching through rows of data. Whether you are preparing regular reports or need a clearer way to monitor results, the focus is on practical structure, accurate information, and a straightforward experience for your needs and for easier reporting and clear results.
What I specialize in
Why choose me?
What you benefit from
Have your data ready? Send your requirements and lets create an Excel solution that fits your needs.
Lets Make Your Data Clearer Smarter And Easier to Understand
Languages
1. My spreadsheet is messy. Can you still work with it?
Yes, if the information is usable. I can review the structure first and confirm what can realistically be handled within your selected package.
2. I know what I want to track, but I don't know which charts to use. What should I do?
Send your goals and available data. I can help determine practical chart options that make the important information easier to understand.
3. Can you build around the way my business currently reports its numbers?
Yes. Share your existing reporting process, data, and requirements so the dashboard can be structured around your actual workflow.
4. What if my data contains more information than the package covers?
That is fine. We can review the data before starting and define the appropriate scope rather than making assumptions about the workload.
5. Can I request changes to the dashboard after seeing the first version?
Yes. Changes can be discussed according to the agreed project scope and the revision allowance included with your selected package
6. I already have an Excel report. Do I need to start from scratch?
Not necessarily. If the existing file is suitable, I can work from it instead of rebuilding everything. Send it for review before ordering.
7. How do we make sure the final result matches what I actually need?
Clear requirements come first. I review your data, goals, preferred information, and package scope before starting so the expected result is understood from the beginning.