Are you drowning in raw Excel data? Stop manually sifting through spreadsheets and start making instant, informed decisions! I will transform your messy data into a stunning, professional, and dynamic Excel Dashboard that brings your key performance indicators (KPIs) to life.
I specialize in creating custom Excel solutions, including:
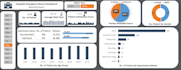
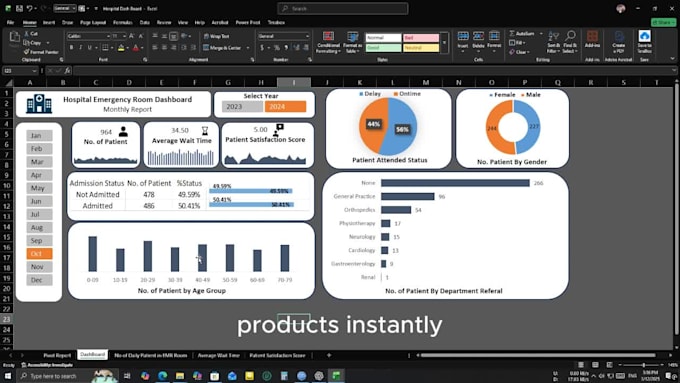
- Interactive Dashboards: Use Pivot Tables, Pivot Charts, and Slicers to filter and explore your data instantly (e.g., filter by month, product, or region).
- Aesthetically Pleasing Visuals: High-impact charts (Bar, Line, Pie, Gauge, etc.) with custom formatting to ensure your data tells a clear story.
- Advanced Formula & Function Implementation: I use formulas like SUMIFS, COUNTIFS, VLOOKUP/XLOOKUP, and Power Query (if needed) for robust calculations.
- Automated Reporting: Design a template where you just paste new data to instantly refresh all reports and visualizations.
- Custom KPIs: Setup clear metrics for Sales, Finance, Inventory, Marketing, or any other business domain.