Browse categories
Explore
Fiverr Pro
English
$
USD
Do you have a messy dataset and need clear insights from it?
I'll help you turn raw, messy data into clean, easy-to-understand analysis with meaningful visualizations using Python (Pandas, Matplotlib, Seaborn).
What I can do for you:
Clean and organize messy datasets (missing values, formatting issues, duplicates)
Explore and summarize your data (trends, patterns, comparisons)
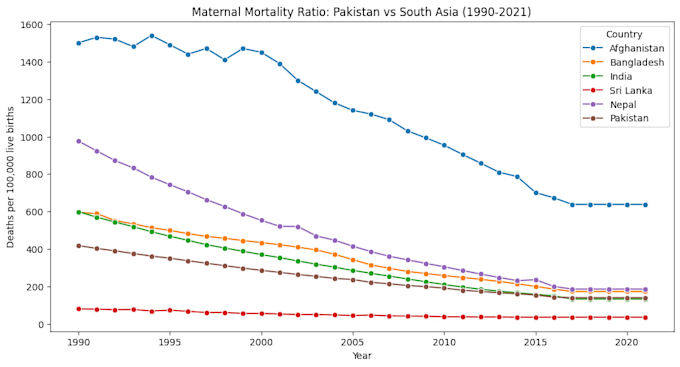
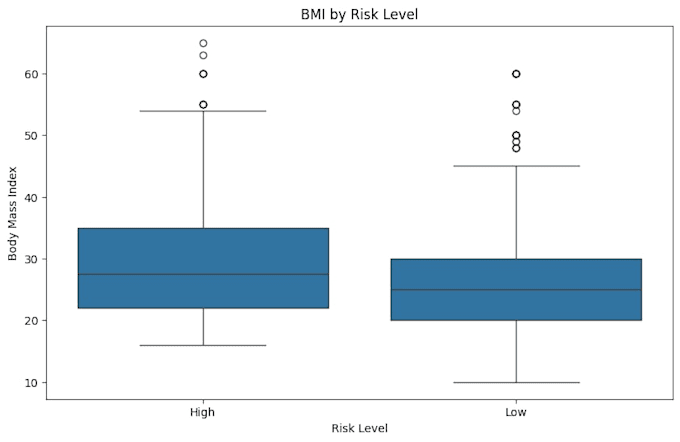
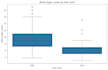
Create clear visualizations (line charts, bar charts, boxplots) to make your data easy to understand
Write a short, clear summary of key findings no confusing jargon, just what the data actually means for you
Recently, I completed a personal project analyzing maternal health trends across Pakistan and South Asia, combining country-level mortality data with clinical risk-factor data including catching and fixing a real data quality issue during the analysis. You can see the full project on my GitHub.
Whether you have survey data, business data, research data, or anything in between I'll help you understand what it's actually telling you.
Let's discuss your project message me before ordering if you're not sure which package fits your needs!
_a4bo5a.jpg)

What format should my data be in?
CSV or Excel files work best. If you have something else, just message me and we'll figure it out.
Do you build dashboards (Power BI/Tableau)?
Not yet — I currently specialize in Python-based analysis and visualization. I'm expanding into dashboard tools soon.
Can you help me understand what my data means, not just clean it?
Yes — that's actually my focus. I always include a written summary of key findings, not just charts.