Browse categories
Explore
Fiverr Pro
English
$
USD
MPhil Statistics, SPSS, R and Biostatistics Expert
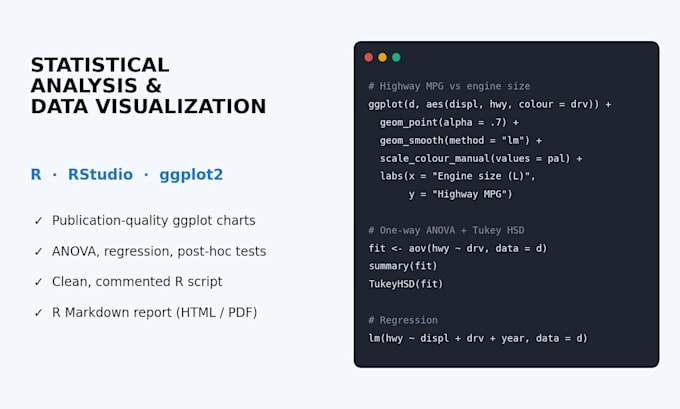
Need professional statistical analysis or publication-quality charts in R? I will write clean, commented R code in RStudio and turn your data into clear results and beautiful visualizations.
WHAT I OFFER
- Data cleaning and wrangling with dplyr and tidyr
- Publication-ready charts with ggplot2 (scatter, box, bar, heatmap, faceted plots)
- t-test, ANOVA with post-hoc tests, chi-square
- Linear and logistic regression with diagnostics
- Correlation analysis and descriptive statistics
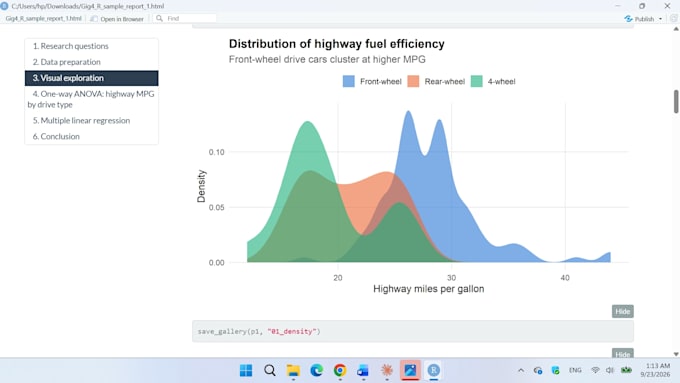
- R Markdown reports (HTML, Word or PDF)
WHAT YOU GET
- Fully commented R script you can re-run anytime
- High-resolution charts (PNG or PDF)
- Results tables with a clear interpretation
- R Markdown report on request
WHY ME
- Clean, reproducible code that is easy to understand
- Charts styled for reports, theses and journals
- Free revisions and on-time delivery
Send me a message before ordering with your data and what you need, so I can confirm the analysis and price.

What do you need from me to start?
Your data file (CSV, Excel, SPSS or RData) and a short description of the analysis or charts you need.
Will I get the R code?
Yes. You receive the full, commented R script so you can reproduce every result and chart yourself.
can you edit or fix my existing R code?
Yes. Send me your script and the error message, and I will fix it and explain what went wrong.
Can you match my journal's chart style?
Yes. I can adjust fonts, colors, sizes and export formats to match your journal or university guidelines.