Browse categories
Explore
Fiverr Pro
English
$
USD
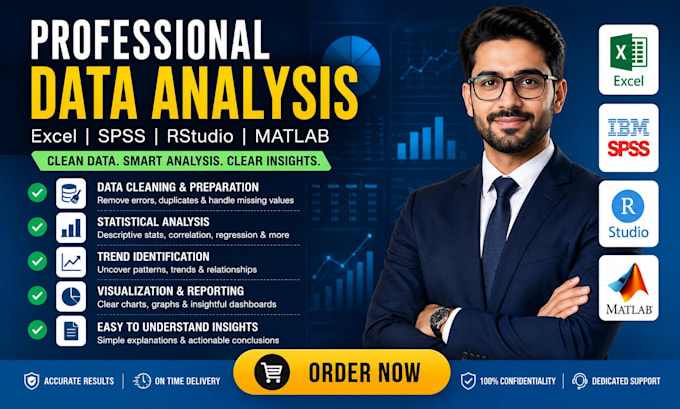
Struggling with messy, confusing, or incomplete data that you cant make sense of? I will turn your raw data into clear, structured, and actionable insights so you can finally understand what your numbers are saying.
I handle data cleaning, organization, and statistical analysis using Excel, SPSS, RStudio, and MATLAB to uncover patterns, trends, and relationships hidden in your dataset.
You will get:
This service is ideal if you are stuck with research data, survey results, business performance data, or academic projects and dont know how to turn them into meaningful conclusions.
Instead of just giving you numbers, I explain what the data means and how it impacts your goal, whether that is decision-making, reporting, or research submission.


What type of data can you analyze for me?
I handle business, academic, survey, financial, and experimental data in Excel, SPSS, RStudio, and MATLAB. As long as your data is structured or semi-structured, I can clean it, analyze it, and turn it into clear insights.
Can you fix messy or incomplete datasets?
Yes. I clean duplicates, handle missing values, correct formatting issues, and structure your dataset properly so it’s ready for accurate statistical analysis and visualization without errors affecting your results.
Will you explain the results or just send charts?
I don’t just send charts. I explain what the results mean in simple terms so you understand patterns, trends, and relationships clearly and can use them for decisions, research, or reporting.
Can you do statistical tests like correlation or regression?
Yes. I perform correlation analysis, regression, hypothesis testing, and other statistical methods depending on your data and goals to help you uncover meaningful relationships and insights.
What tools do you use for analysis?
I use Excel for quick analysis and visualization, SPSS for statistical testing, RStudio for advanced modeling, and MATLAB for complex computations depending on the project requirement.
How fast can you deliver my analysis?
Delivery depends on dataset size, but small projects are usually completed within 24–48 hours. Larger or more complex datasets may take longer to ensure accuracy and proper interpretation.
Can you create graphs and visual reports?
Yes. I create clear charts, graphs, and visual summaries that make your data easy to understand at a glance, helping you quickly identify trends and patterns without confusion.
Do I need to know statistics to use your service?
No. You don’t need any technical knowledge. I handle the analysis and explain everything in simple language so you can understand and apply the results easily.
Can you help with academic research or assignments?
Yes. I assist with research data analysis, thesis support, and assignment interpretation by applying proper statistical methods and delivering well-structured, academic-ready outputs.
What makes your service different from others?
I don’t just process data, I interpret it. You get cleaned datasets, proper statistical analysis, visual insights, and clear explanations that help you make real decisions instead of just seeing numbers.