Browse categories
Explore
Fiverr Pro
English
$
USD
Excel models for budgets, cash flow and KPIs, built from your figures
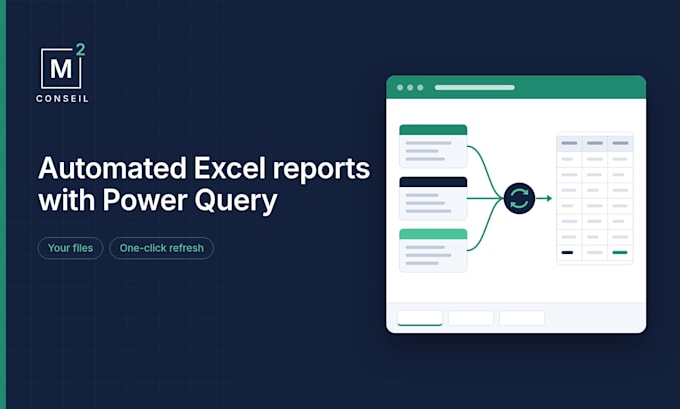
You get a refreshable Excel file built from your own files. Instead of copying, pasting and reformatting data, you click Refresh and your report updates. Everything is delivered in English or French, as you choose.
It is made for the owner of a shop, a restaurant, a workshop or a small agency who rebuilds the same report every week or month from sales, order, stock or tracking files, and would rather spend that time on decisions.
We study the sample files you send, then build Power Query steps that combine them, standardize formats, drop empty rows and add calculated columns. Every step is named. The queries read your files and never change your source data. We test the file with your samples and deliver it with a one-page refresh guide.
With Premium you also get a one-page note, "What your numbers show". It describes what the refreshed report gives with your figures. The decisions stay yours.
It is a working tool for you, the owner. We do not prepare documents meant to be handed to outside parties.
We build Excel tools only. The figures are yours: we do not check or correct them, and you enter and update them yourself.

Technology:
Excel
Expertise:
ETL
•
Transformation
Will you refresh the reports for us each month?
No. We deliver the automated file and show you how to refresh it yourself: put the new file in the folder and click Refresh.
Which Excel versions work?
Power Query is built into recent versions of Excel for Windows (2016 and later). Tell us your version and system when you order, and we confirm before we start whether it fits.
What if the source files change?
If a column is renamed or added, the guide shows how to adjust the step concerned. A bigger change to your files is a new order.
Do you need real data?
No. A sample is enough, with names replaced by codes. Please do not send personal data. If personal data reaches us by mistake, tell us and send an anonymised file instead.
What is in each package?
Basic: 1 fixed-layout file, 1 query, 1 tidy table, tested on 2 periods, no summary or chart. Standard: 2 files or 1 monthly folder (same layout), up to 3 queries, 1 mapping table, 1 summary, 1 chart. Premium: up to 4 files, 1 folder, up to 6 queries, 2 mapping tables, 2 summaries, 2 charts, note.
What is a mapping table?
A small table you give us, for example product to category, that the queries use to label your data. It stays in the file, so you can change a line yourself and click Refresh.
Can we work in French?
Yes. The file, the refresh guide and the note are delivered in English or French, as you choose, and you can write to us in either language. Oui, nous travaillons aussi en français : fichier, guide et note.
What is the "What your numbers show" note?
A one-page note, with Premium only. It reads your refreshed report with your own figures and describes what it gives, such as the month with the highest total or the line that weighs most. It never says what to do: the decisions stay yours.
