Browse categories
Explore
Fiverr Pro
English
$
USD
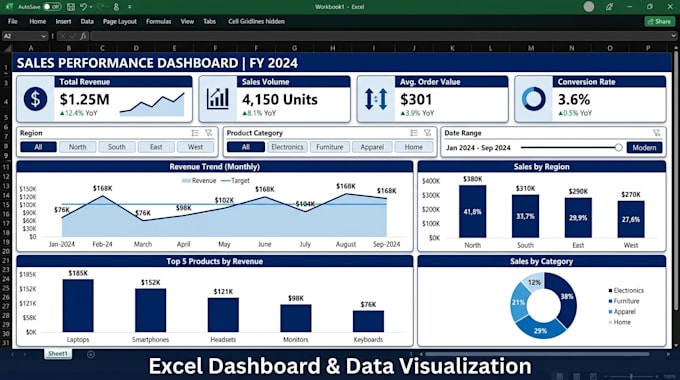
I will create professional, interactive, and visually stunning Excel dashboards and data visualizations that transform your raw data into clear business insights.
Turn complex data into easy-to-understand reports with modern charts, KPIs, slicers, and dynamic filters.
Perfect for:
Whats Included:
I use Excel (Pivot Tables, Power Query, VBA) to deliver fast, accurate, and impressive dashboards that help you make better decisions.
Send me your data and let me turn it into a powerful management tool!


Technology:
Excel
•
Google Analytics
•
Google Sheets
•
VBA
Expertise:
Business Insights
•
Trends
Programming language:
SQL
What kind of data can you work with?
I can work with any kind of data — sales, marketing, inventory, finance, operations, etc.
Do you create interactive dashboards?
Yes, I create fully interactive dashboards with slicers, filters, drop-downs, and buttons.
Will I get the original Excel file?
Yes, you will receive the fully editable Excel file with all formulas and source data.
Can you match my company branding?
Absolutely. Just send me your logo and brand colors.
How many revisions do you offer?
Basic: 2 revisions | Standard: 4 revisions | Premium: Unlimited revisions.