Browse categories
Explore
Fiverr Pro
English
$
USD
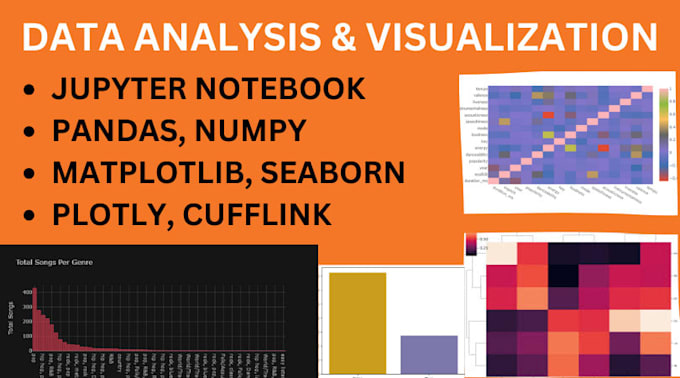
Expert in Data Analysis and Visualization using Excel and Python
Level 1
Has met certain performance criteria and shows strong potential in the marketplace.
Are you an e-commerce brand or business owner overwhelmed by raw sales data? Stop guessing and start scaling. I specialize in turning messy Excel/CSV sales data into clear, actionable business insights using Python.
How I help your business grow:
What you will receive:
Tools used: Python (Pandas, Plotly, Seaborn, Matplotlib).
Please message me with your dataset before placing an order to ensure a perfect delivery!


Can I contact you beforehand to discuss the project?
Yes! Communication is key. And I am more than happy to discuss the project with you beforehand. Please feel free to contact me at anytime.
Is my business data kept confidential and secure?
Absolutely. I take data privacy very seriously. Your sales and e-commerce data will strictly be used for the purpose of the analysis and will be permanently deleted from my local systems once the order is successfully completed and approved by you.
What format should my data be in before sending it to you?
I can work with almost any structured data format. The most common formats I process are Excel (.xlsx), CSV, JSON, or direct exports from platforms like Shopify, Amazon, or WooCommerce. If your data is in a different format, just send me a message first!
Can you do a custom analysis that isn't listed in your packages?
Yes! Every business is unique. If you need advanced predictive modeling, specific time-series forecasting, or a highly customized interactive dashboard, please message me with your requirements, and I will create a custom offer tailored to your specific goals.
What will the final delivery look like?
Depending on the package you choose, you will receive a fully commented Jupyter Notebook containing the Python code, a clean PDF/HTML report summarizing the business insights, and an interactive dashboard (using Plotly/Seaborn) that you can easily navigate.