Browse categories
Explore
Fiverr Pro
English
$
USD

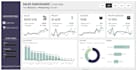
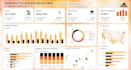
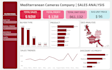
PLEASE CONTACT ME BEFORE PLACING AN ORDER. THANK YOU.
If you have data in Excel, CSV, SQL, or any other source and you want to create Data Visualization, Dashboard, and Reports using Power BI, then this gig is for you!
This gig will cover:
Data Visualization
ETL
Data Analysis
Data Story Telling
Dashboard Making
Embedding
Data Modelling
Statistical Analysis
DAX
Power Query
M code
Business Intelligence Reports
Consultations
Data connectivity
Many more.....
#data visualization #data modeling #powerbi #power bi dashboard
#power #powerbidashboard #dashboard #report #create #dax #power bi #dashboard #report #POWER BI #automation
A Data Visualization Expert
Languages
What Power BI services do you provide?
I provide end to end Power BI services including data cleaning, data transformation, data modeling, DAX measure creation, and development of fully interactive and professional Power BI dashboards and reports.
What type of data sources can you connect to Power BI?
I can connect to a wide range of data sources, including Excel, CSV, SQL Server, Google Sheets, Azure, SharePoint, and Web APIs. Whether your data is on premise or in the cloud, I will ensure a seamless integration into your Power BI dashboard.
Can you help with complex DAX measures and calculations?
Absolutely. I specialize in writing advanced DAX (Data Analysis Expressions) to create complex measures, calculated columns, and time intelligence calculations (like YOY growth or YTD totals). This ensures your business intelligence reports provide deep, actionable insights.
Will my Power BI report be interactive and mobile friendly?
Yes! I design interactive Power BI reports with drill-through capabilities, slicers, and cross filtering. I also optimize layouts for Power BI Mobile, so you can track your business KPIs on the go from any device.
Can you fix issues in my existing Power BI dashboard?
Yes, I can audit your current Power BI desktop files to fix broken links, optimize slow-loading visuals, or update outdated DAX formulas. I’ll make your existing reports faster and more efficient.
Do you provide data cleaning and ETL services?
Yes, data preparation is key. I use Power Query (M language) to perform ETL (Extract, Transform, Load) processes. I will clean, shape, and transform your raw data to ensure your data visualization is accurate and error-free.
What information do you need to start the project?
I typically need your dataset, business requirements, KPIs to track, and preferred dashboard style or reference examples.
Do you offer revisions and support after delivery?
Yes, I provide revisions based on package terms and ensure client satisfaction with post-delivery support if needed.


