Browse categories
English
$
USD
Connect to your AI

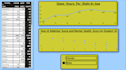
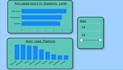
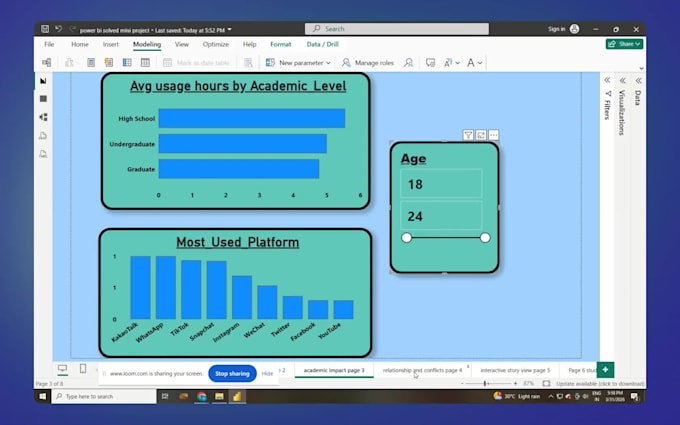
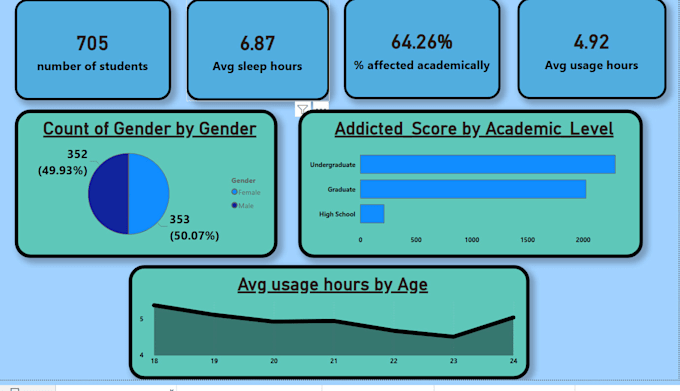
Social Media Addiction Analysis Dashboard | Power BI
Developed an interactive Power BI dashboard to analyze social media usage patterns among 705 students and explore their impact on academic performance, sleep habits, mental health, and relationships.
Key Features:
Tools & Skills Used: Microsoft Power BI, Power Query, Data Visualization, Dashboard Design, KPI Reporting, and Interactive Data Analysis.
This project demonstrates my ability to transform raw data into meaningful visual insights that support better understanding and data-driven decision-making.
MIS Executive, Data Analyst
Languages
1: What do you need to get started?
I need your dataset in Excel, CSV, or another supported format, along with your project requirements, preferred KPIs, and any reference dashboard or design.
2: Can you create an interactive Power BI dashboard?
Yes! I can create interactive dashboards with charts, KPI cards, slicers, filters, and clear visualizations to help you explore your data.
3: Do you provide the Power BI source file?
Yes, I can provide the Power BI Desktop (.pbix) file according to the package you select.
4: Can you clean and transform my data?
Yes, data cleaning and transformation using Power Query are available depending on your selected package and project requirements.
5: Can you customize the dashboard design?
Yes! I can customize colors, layouts, charts, and KPI cards based on your business needs or preferred design.
6: Do you work with beginners or small businesses?
Yes! I welcome projects from students, individuals, startups, and small businesses looking for clear and affordable data visualization solutions.
7: Can you explain the dashboard after completion?
Yes, I can provide a brief explanation of the dashboard's key visuals and insights. A detailed walkthrough can be discussed before ordering.