I will do the graphical representation of your data

M
mrunastatistics
M
mrunastatistics
Mrunastatistics

About this gig

***Kindly contact me before placing your order to discuss what exactly you need.***

Are you facing any challenges in handling your statistical work?

Do you need a detailed visualization of your data?

I will help you in:

  • Preliminary data analysis
  • Descriptive data analysis

Graphical representation mainly includes:

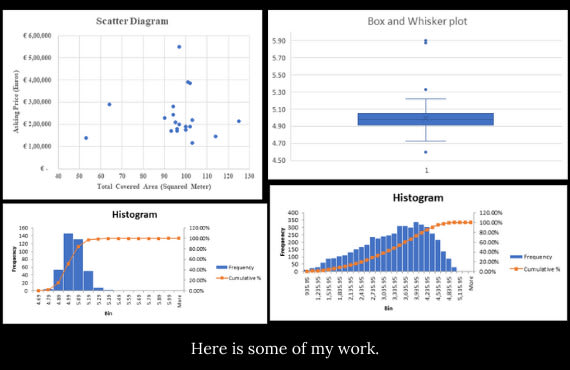
  • Histogram
  • Bar diagram or bar chart or bar graph
  • Dot plot
  • Frequency polygon
  • Cumulative frequency curve or ogive curve
  • Line graph or stick graph
  • Pie chart
  • Line chart or time plot
  • Stem and leaf plot
  • Box and whisker plot
  • Scatter plot
  • Frequency distribution

And may more.

I will represent your data manually or with the help of R studio or MS Excel or Python programming.

Please check my other gigs to explore more topics.

Thank you.

Get to know Mrunastatistics

Mrunastatistics

Data Analyst, Excel, Power BI and Statistical Analysis

5.0(72)
  • FromIndia
  • Member sinceAug 2020
  • Last delivery1 year
  • Languages

    English, Marathi, Hindi
Hi, I’m Mrunal, a Data Analyst with a postgraduate degree in Statistics, specialising in transforming raw data into clear and actionable insights. I work on data cleaning, exploratory data analysis, Power BI dashboard development, statistical analysis, hypothesis testing, Excel reporting, SQL querying, and academic or research support. I help businesses, students, and professionals make informed decisions through structured analysis and effective data visualisation, with a strong focus on accuracy, clarity, and timely delivery of high-quality results. I look forward to collaborating with you.

Other Data Visualization Services I Offer