Browse categories
Explore
Fiverr Pro
English
$
USD
BS Statistics Student
Do you need professional charts and graphs
created in R programming for your research,
thesis, or assignment? I will help you!
I am a BS Statistics student at Punjab University
Lahore with hands-on experience in R programming
for data visualization and basic statistical
analysis.
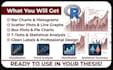
WHAT I WILL DO FOR YOU:
- Bar charts and histograms
- Scatter plots and line graphs
- Box plots and pie charts
- Basic t-tests and comparing group averages
- Clean and well-labeled professional graphs
- Export graphs in PNG, PDF or JPG format
PERFECT FOR:
- University students with R assignments
- Researchers needing data visualizations
- Anyone with dataset needing graphs in R
- Thesis students needing professional charts
WHAT I NEED FROM YOU:
- Your dataset (Excel or CSV file)
- Which type of graph or chart you need
- Any specific colors or labels you want
All graphs delivered clean, labeled and
ready to use in your report or thesis!
Message me before ordering if you have questions.
What file format should I send my data in?
You can send your data in Excel (.xlsx) or CSV format. I will load it into R and create your graphs from it.
In what format will you deliver the graphs?
I deliver all graphs in PNG format by default which is high quality and ready to use in any report or thesis. I can also deliver in PDF or JPG if needed.
Can you add titles and labels to the graphs?
Yes! All graphs will have proper titles, axis labels, and legends so they are ready to use directly in your assignment or research paper.
Can you do statistical tests in R as well?
Yes I can perform basic statistical tests like t-tests and compare averages between groups. This is included in my Standard and Premium packages.
What if I do not know which chart I need?
No problem at all! Just send me your data and tell me your goal. I will suggest the best chart type for your data and research purpose.
Will my data be kept confidential?
Yes absolutely. Your data is completely safe and private. I will never share or use your data for any purpose other than your order.


