Browse categories
Explore
Fiverr Pro
English
$
USD

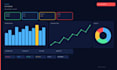
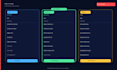

Do you have data in Excel or CSV but no way to visualize it properly? I will build you a beautiful, interactive Streamlit dashboard in Python! WHAT I WILL BUILD: - Upload your CSV/Excel and see charts instantly - Bar charts, line graphs, pie charts, heatmaps - Filter data by date, category, or any column - KPI summary cards (Total Sales, Revenue, Users, etc.) - Download filtered data as CSV - Deploy online so anyone can access it PERFECT FOR: - Sales & revenue tracking - Student or employee performance reports - Inventory and stock monitoring - Survey or research data analysis TECH STACK: Python | Streamlit | Pandas | Plotly | Matplotlib Send me your data file first I will review it FREE and tell you exactly what dashboard I can build!
Flask and PHP Developer, Python Automation
Languages
Do I need to install anything to use the dashboard?
No! I can deploy it online using Streamlit Cloud. You just open a link in your browser.
What data format do you need from me?
CSV or Excel (.xlsx) files work best. I can also connect to Google Sheets.
Can I update the data myself later?
Yes! I will show you exactly how to upload new data and refresh the dashboard.
Can you add a login/password to the dashboard?
Yes, that is included in the Premium package


