Browse categories
Explore
Fiverr Pro
English
$
USD

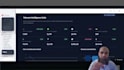
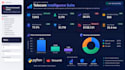
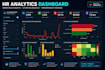
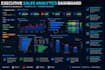


Do you need a professional, interactive dashboard that turns your data into clear and actionable insights?
I will build a custom Python + Streamlit interactive dashboard designed around your business goals, KPIs, and data. Whether you need a sales, HR, healthcare, finance, customer, marketing, or operational dashboard, Ill transform your data into an easy-to-use analytical interface.
What I offer:
Why work with me?
I combine Python data analytics, business intelligence, and real-world healthcare/business experience to create dashboards that go beyond attractive charts. My focus is on helping users quickly understand what is happening, why it matters, and where action may be needed.
I work with Python, Pandas, NumPy, Matplotlib, Seaborn, and Streamlit, using clean and reproducible workflows.
Whether you need
Pharmacist and Data Analyst
Languages
What types of dashboards can you build?
I can build interactive dashboards for sales, finance, HR, healthcare, customer analytics, operations, marketing, and other business use cases, with KPIs, charts, filters, and actionable insights.
Will my dashboard be interactive? Can you build the dashboard using Python and Streamlit?
Yes. I can add interactive filters, selectors, KPI cards, charts, tables, and other dashboard controls depending on your requirements and package. Yes. I use Python and Streamlit to create responsive, interactive dashboards designed for easy exploration of your data.
Do I need to provide my dataset before ordering? Can you work with Excel or CSV data?
No. You can share your CSV, Excel file, Google Sheets link, or other supported data source after placing your order through Fiverr's requirements form. Yes. CSV and Excel files are commonly supported. I can clean and prepare the data before connecting it to the dashboard.
Can you create custom KPIs and charts?
Yes. I can create KPI cards and visualizations based on your business requirements, including bar charts, line charts, trend analysis, comparisons, heatmaps, tables, and performance metrics.
Can you work with large datasets?
Yes, but the appropriate approach depends on the dataset size, complexity, and required dashboard functionality. For large datasets, please message me before ordering so I can recommend the appropriate package.
Will I receive the Python source code?
Yes. The applicable packages include the dashboard source code and supporting files so you can review, maintain, and further develop the project.
Can you deploy the Streamlit dashboard?
Yes, where included in the selected package. I can help prepare the dashboard for deployment and provide the necessary project files and deployment guidance.
Can you redesign or improve my existing dashboard?
Yes. I can improve an existing dashboard's layout, KPIs, visualizations, usability, and overall presentation. Please share your current dashboard and requirements before ordering.
Can you handle confidential business data?
Yes. I treat client data as confidential. For additional safety, remove personal identifiers or sensitive information that is not necessary for the dashboard.
What if I don't know what dashboard I need?
That's completely fine. Share your business objective, dataset, and the questions you want the dashboard to answer, and I can recommend an appropriate dashboard structure and KPIs.


