Browse categories
Explore
Fiverr Pro
English
$
USD


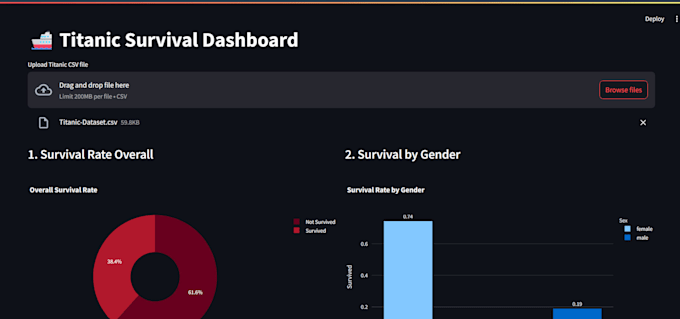
Are you sitting on data but don't know what story it tells? I'll build you a clean, interactive dashboard that makes your data easy to understand and act on.
I'm a Data Science & Analytics student at Delhi University with hands-on project experience building real dashboards using Python, Streamlit, and Plotly.
What you'll get:
Tools I use: Python, Pandas, Plotly, Streamlit, Matplotlib, Seaborn
My work includes:
Whether you need a quick 3-chart overview or a fully deployed live dashboard, I have a package for you.
Message me before ordering if you have questions about your dataset I'm happy to check if it's a good fit first.
Let's make your data work for you.
Data Analyst
Languages
Q: What format should my data be in?
CSV or Excel works best. If your data is in another format, message me before ordering and I'll let you know if it's compatible.
Q: What if I don't have data yet?
I can work with sample or synthetic datasets to build a demo dashboard. Message me and we'll figure it out.
Will I be able to edit the dashboard myself after delivery?
Yes, I'll share the full Python source code so you can make changes. I can also walk you through it if needed.
Do you offer a live/hosted dashboard link?
Yes — the Premium package includes deployment on Streamlit Cloud with a shareable live link.
What if I'm not satisfied with the result?
I offer revisions with every package. Message me before raising a dispute — I'll always work with you to get it right.