Browse categories
Explore
Fiverr Pro
English
$
USD
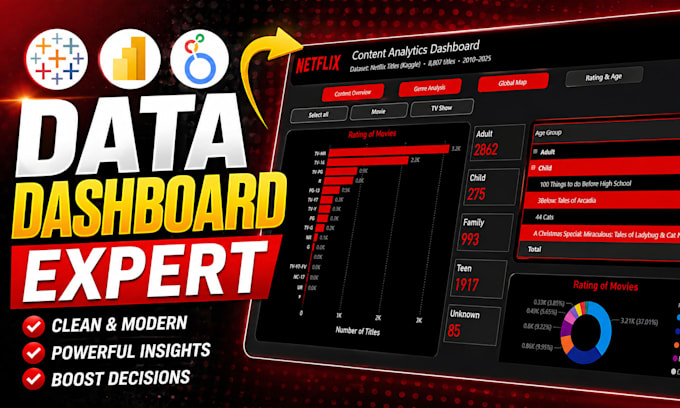
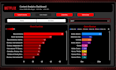
I turn complex data into clear, actionable business insights using Tableau Power Bi and looker studio?
As a professional data analyst and Power BI developer with 2+ years of experience, I help businesses understand their data through clean, interactive, and decision-ready dashboards. I specialize in building Power BI dashboards and Tableau visualizations that transform raw data into meaningful stories for smarter decision-making.
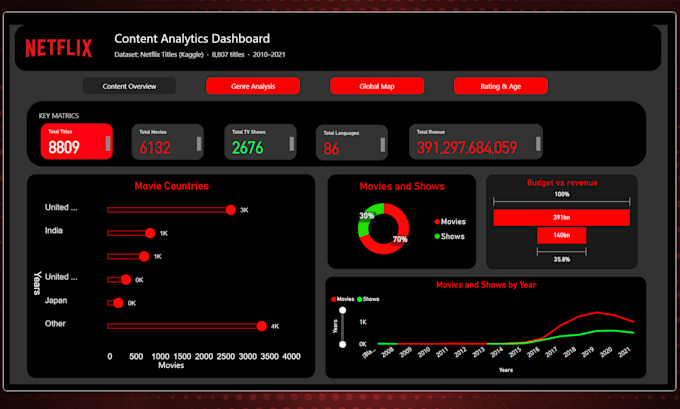
I design dashboards that are not just visually appealing, but truly useful for tracking KPIs, trends, and performance.
What I Offer:
Tools & Skills:
Why Choose Me?
I'm here to help you make sense of your data, lets chat now and build dashboards that drive real results.
What data formats do you accept for building the dashboard?
I work with all common formats including Excel, CSV, Google Sheets, SQL databases, and JSON. If your data is in a different format, just message me and we'll figure it out together.
Can you connect my Power BI or Tableau dashboard to a live data source?
Yes! I can connect your dashboard to live sources like SQL Server, MySQL, Google Sheets, Excel Online, and APIs so your data updates automatically in real time.
Will I be able to edit the dashboard myself after delivery?
Absolutely. I deliver fully editable files (.pbix for Power BI, .twbx for Tableau) with a short guide so you can update filters, data, and visuals on your own without any extra cost.
What if my data is messy or unstructured?
No problem — data cleaning and transformation is part of my process. I use Power Query and Tableau Prep to structure your data before building the dashboard so the output is accurate and reliable.
How many charts or visuals are included in one gig package?
It depends on the package you choose, but typically my packages include 5–10 interactive visuals such as bar charts, KPI cards, trend lines, filters, and slicers. Check my packages or message me for a
Do you provide a mobile-responsive or presentation-ready dashboard?
Yes. I design dashboards that are clean, professional, and ready for executive presentations. For Tableau, I can also optimize the layout for Tableau Public or Tableau Server sharing.
What information do I need to provide to get started?
Just share your dataset, the key metrics you want to track, and any design preferences (colors, branding, layout ideas). If you have a sample dashboard you like, send that too — the more context you give, the better the