Browse categories
Explore
Fiverr Pro
English
$
USD


Grafana Prometheus Node Exporter install / Create / Support / for Grafana Prometheus Node Exporter Redis Exporter
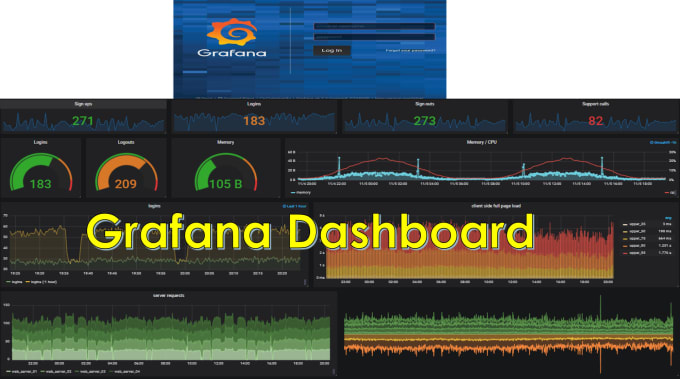
I will create a grafana dashboard:
Create Graph Like (Type: Graph,Singlestat,Guage,Bar Guage,Table,Text,Alert list,Dashboard list and etc) for Services
Save/Export Graph Values in CSV format.
24x7 Monitor Services of your System (Linux Server and etc)
Receive email Alert for Services
Create Alerts (Critical, OK) for services
Installation and Configuration of Grafana, Prometheus and Node Exporter, Redis Exporter
- Integration with Opsgenie (when any alert come then automatic opsgeine ticket open).
- Integration with Slack (when any alert come then automatic goes to slack channel).
Services to Monitor:
Disk space Usage ( df -h all linux mount points)
Cpu stats
Memory
Load (Load 1min, Load5min, Load15min)
Uptime
Users(how many user login to the node)
SSH
netstat and many mores which you want to configure in your Grafana Dashboard.
-> Create Redis Dashboard
Confidentiality on all data sources provided will be guaranteed.
Please Contact before ordering. Thanks
IT Support Consultant, Grafana Nagios NewRelic Kibana Linux
Languages
| (1) | ||
| (0) | ||
| (0) | ||
| (0) | ||
| (0) |

dipal47

India
Great communication, prompt service and reply! recommended service! will contact you in future!
| (1) | ||
| (0) | ||
| (0) | ||
| (0) | ||
| (0) |
dipal47
India
Great communication, prompt service and reply! recommended service! will contact you in future!