Browse categories
Explore
Fiverr Pro
English
$
USD

Level 1
Please contact me before placing an order and share your project details so I can recommend the best solution for your needs.
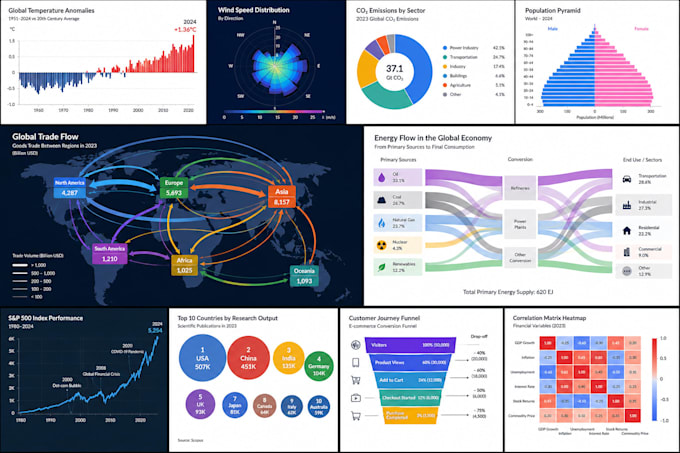
I discovered my passion for data visualization while working in physics and have since helped clients turn complex data into clear, engaging visual stories. Whether you need a simple chart or an interactive visualization, I can help.
Services I Offer:
Whether you need a static graphic, an interactive dashboard, or a custom visualization solution, Im happy to discuss your project and find the best approach.
Deliverables:
I focus on delivering professional, high-quality work and building long-term relationships with my clients.
Feel free to message me anytime with your questions or project requirements. I look forward to working with you!
Softsparks Automations
Level 1
Languages
What types of data visualizations can you create?
I can create a wide range of visualizations including bar charts, line charts, scatter plots, heatmaps, dashboards, maps, infographics, and fully interactive web-based visualizations.
What information do you need to start the project?
Please provide your dataset, project requirements, preferred chart style (if any), and examples or references that you would like me to follow.
Can you recommend the best chart type for my data?
Yes. If you're unsure how to present your data, I can analyze your requirements and suggest the most effective visualization to communicate your insights.
Can you recreate a chart from a screenshot or mockup?
Absolutely. I can develop visualizations based on screenshots, mockups, wireframes, or design specifications provided by you.
Can you improve or redesign my existing charts?
Yes. I can enhance existing charts by improving their visual appearance, readability, user experience, and interactivity.
Do you create interactive visualizations?
Yes. I can build interactive visualizations using HTML, CSS, JavaScript, D3.js, Chart.js, Plotly, and other modern visualization libraries.
What file formats will I receive?
Depending on your requirements, I can deliver PNG, JPG, SVG, PDF, or complete HTML/CSS/JavaScript source files.
Can you work with large or complex datasets?
Yes. I have experience working with large datasets and can create optimized visualizations that remain fast and user-friendly.
Do you provide revisions?
Yes. Revisions are included according to the package you select. My goal is to ensure the final result meets your expectations.
Why should I contact you before ordering?
Every visualization project is unique. Contacting me first allows us to discuss your requirements, timeline, and scope so I can recommend the most suitable package and avoid misunderstandings.