Browse categories
Explore
Fiverr Pro
English
$
USD
I am a part-time data analyst with expertise in Power BI, Python, Excel, SQL, and Google Sheets. I turn raw business and survey data into clear, actionable insights. I clean and preprocess datasets, analyze trends, create visualizations, and summarize findings in an easy-to-understand format.
Depending on your needs:
No matter the dataset size, I deliver accurate, insightful, and visually appealing results to help you make informed decisions and drive business growth.


What type of data can you analyze?
I can work with survey data, business datasets, sales reports, Excel files, CSVs, SQL outputs, and more. Basically, if it’s in a structured format, I can analyze it and provide insights.
Which tools do you use?
I mainly use Power BI, Python (Pandas, Matplotlib, Seaborn), Excel, SQL, and Google Sheets. For dashboards and reporting, Power BI is heavily used by me.
Can you handle large datasets?
Absolutely! My Premium package is designed for large datasets with detailed analysis, interactive dashboards, and professional reports.
Do you provide insights from open-ended / text responses?
Yes! I can perform basic to advanced text analysis depending on the package you choose—so your qualitative responses won’t go unnoticed.
Can you help with survey question design?
Yes, for Premium packages, I can help craft effective survey questions to ensure your data collection is meaningful and actionable.
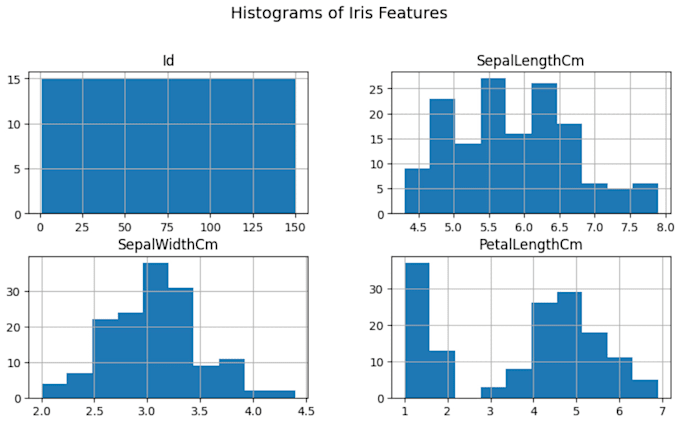
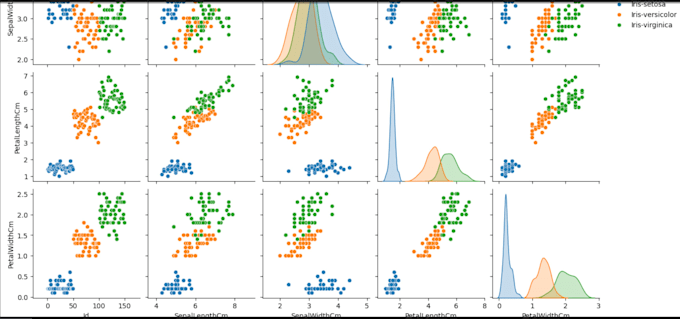
Will I get visualizations and charts?
Yes! From simple charts in Basic packages to interactive dashboards in Premium, all visualizations are designed to be clear, insightful, and ready to use.