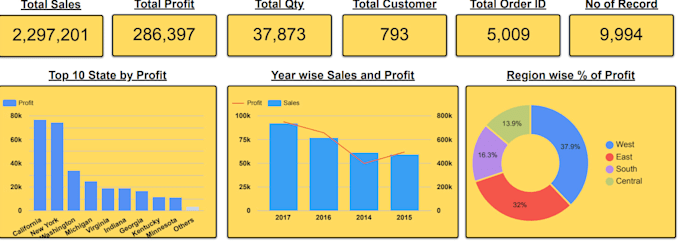
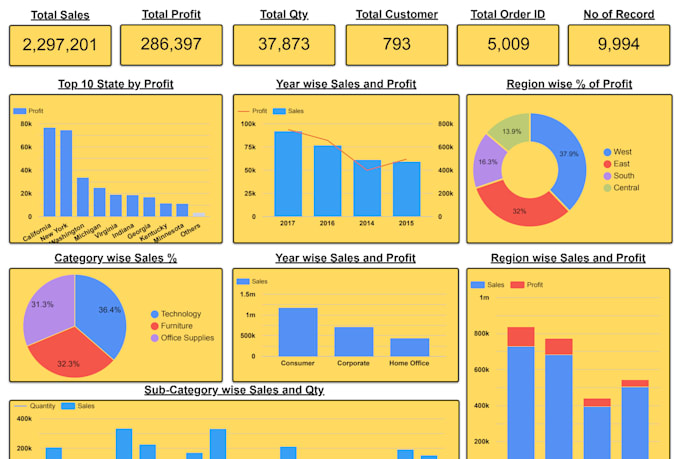
This sales performance dashboard summarizes key business metrics across revenue, profitability, geography, customer segments, and product categories.
Key Performance Indicators (KPIs)
- Total Sales: 2,297,201
- Total Profit: 286,397
- Total Quantity Sold: 37,873 units
- Total Customers: 793
- Total Orders: 5,009
- Total Records: 9,994 entries
Visual Breakdown & Insights
- Top 10 States by Profit: California and New York lead substantially with profits nearing 80k each, followed by Washington, Michigan, Virginia, Indiana, Georgia, Kentucky, Minnesota, and others.
- Year-wise Sales & Profit Trends: Tracks annual progression from 2014 through 2017, showing consistent upward momentum in both overall revenue and net margins.
- Regional Contribution:
- Profit Share: The West region generates the largest profit share (37.9%), followed by East (31.3%), Central (16.3%), and South (13.9%).
- Sales vs. Profit: Confirms West and East as the primary revenue and margin drivers.
- Category & Sub-Category Performance:
- Category Sales Distribution: Technology accounts for the largest share (36.4%), closely followed by Furniture (32.3%) and Office Supplies (31.3%).
- Sub-Categories: Compares sales volume against q