Browse categories
Explore
Fiverr Pro
English
$
USD
Data Analyst ,BI Developer , Finance Analyst , Accountant , Workflow Automation
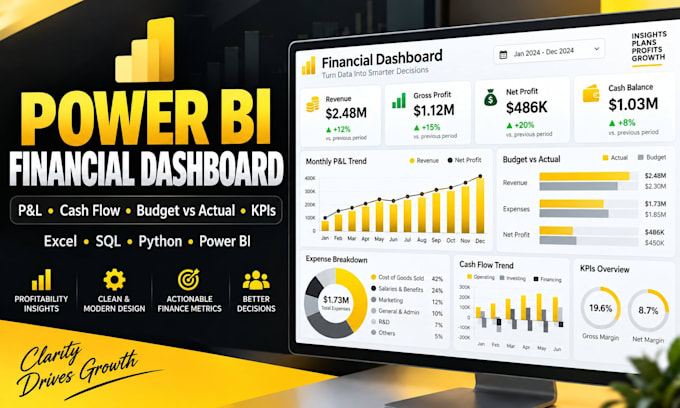
Turn your raw finance data into structured, decision-ready insights.
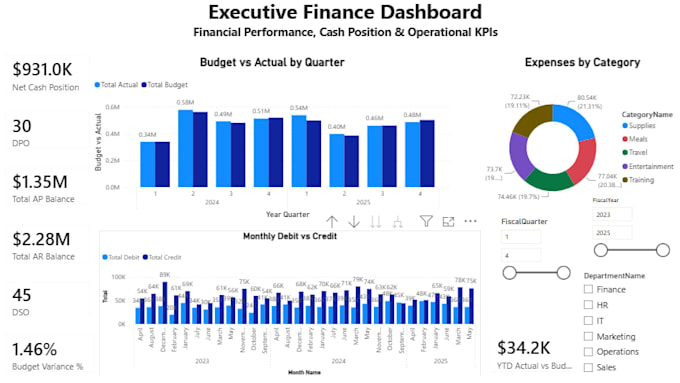
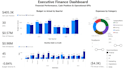
I provide end-to-end financial data analysis using SQL Server and Power BI, from data preparation and quality validation to financial KPIs and interactive dashboards.
Services include:
Tools: SQL Server | SSMS | Power BI | DAX
My approach follows a structured workflow:
Raw Finance Data Staging Data Quality Transformation Star Schema Financial KPIs Power BI Dashboard
Please contact me before ordering Standard or Premium so I can review your data, requirements and project scope.
You can explore my data analytics projects, technical workflows and source code on my GitHub portfolio: github.com/maximyellowrock

What type of financial data can you work with?
I can work with structured financial data such as General Ledger, Accounts Payable, Accounts Receivable, Budget & Forecast, Expense, and other business finance datasets.
What tools do you use for financial analysis?
Depending on the project, I can use SQL Server, Python, Pandas, Excel and Power BI for data preparation and analysis, with DAX, Matplotlib and Plotly for KPIs, dashboards and visualizations.
Can you clean and validate my financial data?
Yes. I can use SQL, Python and Pandas to clean and validate financial data, including checking missing values, duplicates, formatting issues and inconsistencies before analysis.
What financial KPIs can you analyze?
Depending on your data, I can analyze Net Cash Position, AR and AP balances, DSO, DPO, Budget Variance, YTD Actual vs Budget, expenses, and Debit vs Credit.
Can you create financial charts and dashboards?
Yes. I can create interactive Power BI dashboards and financial data visualizations using Python, Matplotlib and Plotly, depending on your requirements.
Can you analyze financial data using Python?
Yes. I can use Python and Pandas for financial data cleaning, transformation and analysis, and Matplotlib or Plotly to visualize the results.
Should I contact you before placing an order?
Yes. Please contact me before ordering Standard or Premium so I can review your dataset, requirements and expected deliverables and confirm the project scope.
How will we communicate during the project?
We can communicate through Fiverr messages throughout the project. I will clarify your requirements before starting, provide updates when needed, and make sure the final analysis and deliverables are clearly explained.
Can you explain the results in a non-technical way?
Yes. My goal is not only to analyze the data, but also to explain the key findings, KPIs, trends and business insights in a clear and understandable way.