Browse categories
Explore
Fiverr Pro
English
$
USD

Level 1
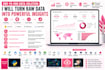


Turn complex business data into clear, professional reports that decision-makers can use.
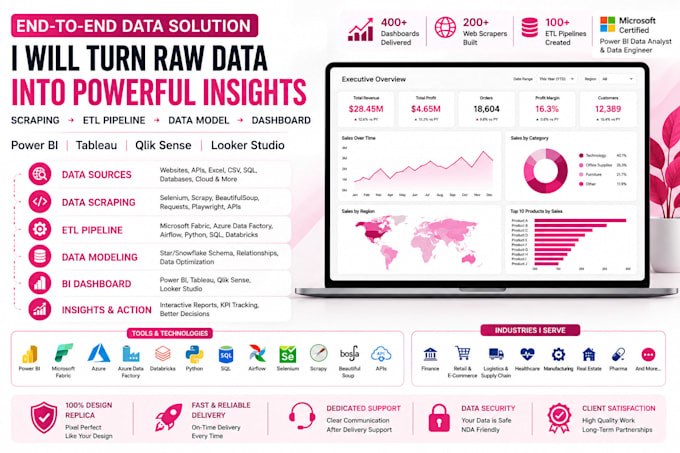
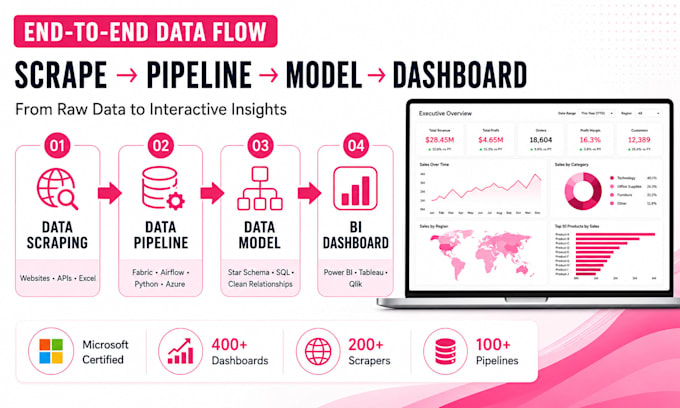
I am a Microsoft-certified BI Developer with 6+ years of experience creating enterprise reports across banking, retail, energy, pharmaceuticals, logistics, finance, and eCommerce. I build interactive Power BI, Tableau, Looker Studio, Qlik Sense, and Excel reports tailored to your KPIs, brand, and audience.
Services included:
Why choose me?
Please message me before ordering with your data source, KPIs, preferred tool, and sample design.
Microsoft Certified Data Engineer, Power BI, Data Automation Expert
Level 1
Languages
What reporting tools do you work with?
I create reports using Power BI, Tableau, Looker Studio, Qlik Sense, Microsoft Excel, SSRS, and Power BI Paginated Reports. Power BI is my primary specialization.
What types of reports can you create?
I can create sales, finance, supply chain, logistics, marketing, HR, customer service, banking, operations, inventory, project management, and executive management reports.
Can you redesign my existing report?
Yes. I can redesign an existing report or dashboard based on your branding, reference image, Figma design, PowerPoint template, PDF, or hand-drawn wireframe. I can closely replicate your preferred layout while improving usability.
Can you migrate Tableau or Qlik reports to Power BI?
Yes. I have professional experience migrating enterprise reports from Tableau and Qlik to Power BI while rebuilding calculations, data models, filters, visuals, and navigation.
Is data cleaning included?
Basic data cleaning is included in the Standard and Premium packages. Complex restructuring, multiple unorganized files, or significant data preparation may require a custom offer.
Which data sources can you connect?
I work with Excel, CSV, SQL Server, MySQL, PostgreSQL, SAP, SharePoint, Google Sheets, Snowflake, BigQuery, Azure SQL, REST APIs, Microsoft Fabric, and other business data sources.
What files will I receive?
Depending on the selected tool, you will receive the editable PBIX, Tableau, Qlik, Looker Studio, or Excel report file. I can also provide PDF or image exports for presentations and sharing.
Do I need a Power BI Pro license?
You do not need a Power BI Pro license to open and edit a PBIX file in Power BI Desktop. A suitable Power BI license may be required to publish and share the report through Power BI Service.
Can you work with confidential business data?
Yes. I can work with anonymized data and follow your confidentiality requirements. Please avoid sharing sensitive passwords directly in the order conversation.
Should I contact you before ordering?
Yes. Please send your data source, required KPIs, number of report pages, preferred platform, deadline, and any reference design. I will review the requirements and recommend the correct package.