Browse categories
English
$
USD
Connect to your AI
I turn business and financial data into decisions Power BI, SQL, Excel
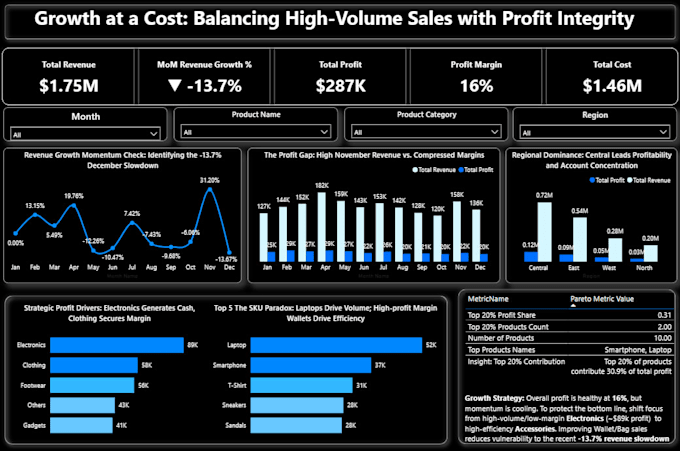
Most Power BI dashboards get built, admired once, and abandoned - because
nobody can tie the number on the screen back to the ledger.
I build the other kind. Five years in accounting and bookkeeping, so I start
from what your finance team needs to reconcile, not from what looks good in a
chart.
WHAT YOU GET
WHAT YOU SEND ME
Your sales or finance export, and one sentence on the decision the dashboard
has to support. That second part matters more than the first - a dashboard
without a decision attached is decoration.
I do not invent data to make a demo look better. If your dataset cannot
support the measure you asked for, I will tell you which one it can.
What data formats can you work with?
Excel, CSV, Google Sheets, and accounting exports (QuickBooks, Sage, etc.). Not sure? Send a sample and I'll confirm.
Can you handle messy or unstructured data?
Yes — I clean and structure it before building. Included in Standard and Premium.
Can I edit the dashboard myself afterward?
Yes. You get the editable .pbix file plus short guidance on refreshing the data.
Do you give insights or just visuals?
Both. Standard and Premium include a written summary of trends, KPI performance, and what to watch.
Can you connect Power BI to live data?
Depends on your setup — message me the details and I'll advise the best approach.
