Browse categories
Explore
Fiverr Pro
English
$
USD


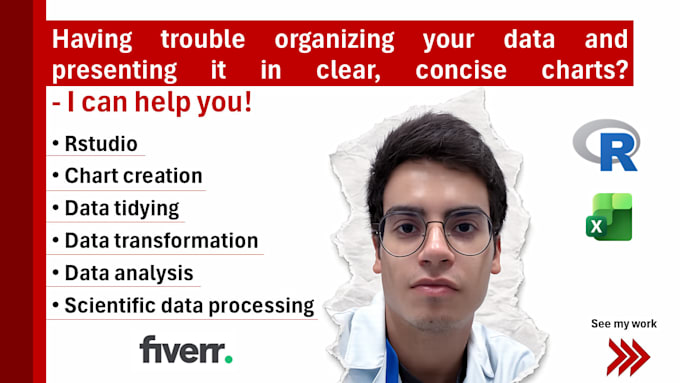
Are you struggling to turn your data into clear and professional graphs? I can help you transform your raw data into clean, well-organized scientific figures.
I am a Masters student in Biochemistry with experience working with experimental data, including chromatography (HPLC) and biochemical assays. I also have experience in organizing and structuring datasets to make them easier to analyze and visualize.
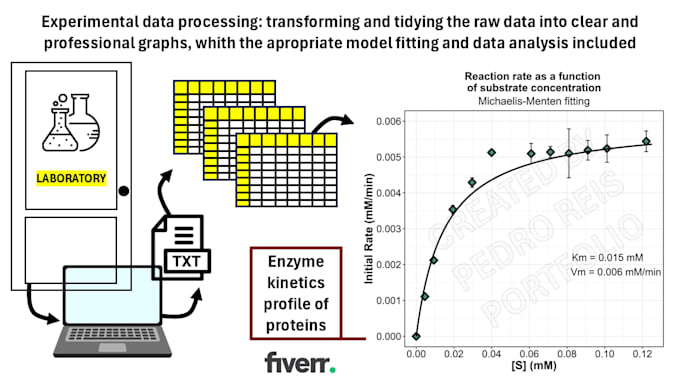
I offer the creation of scientific graphs using R or Origin, with clear labels, titles, and well-structured formatting to ensure your results are easy to understand and present. I work with common graph types such as line graphs, scatter plots, and bar charts.
To get started, you only need to provide your data file (Excel, CSV, or similar) along with a brief description of what you need. This service focuses on data visualization and organization and does not include advanced statistical analysis.
Feel free to contact me before placing an order.
MSc Student in Biochemistry and Immunology
Languages