Browse categories
English
$
USD
Connect to your AI
Azure, Microsoft 365, Networking, Cloud Migrations, Architecture
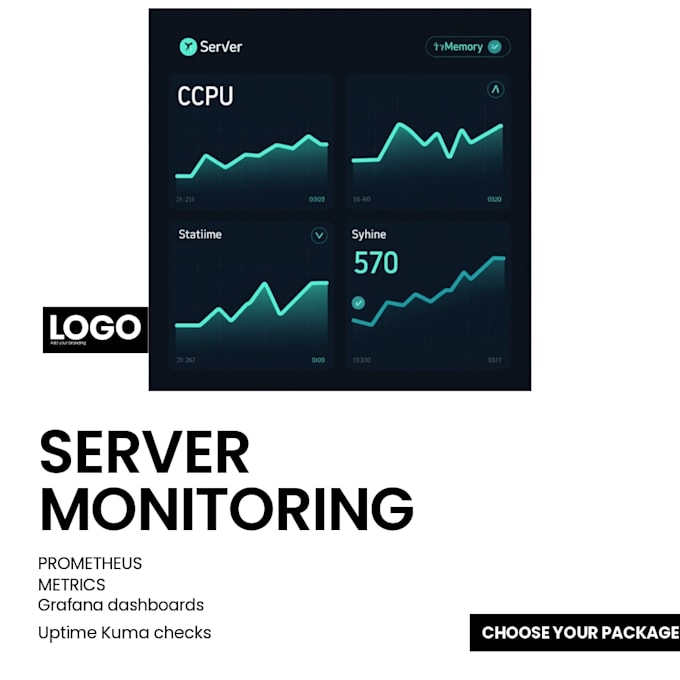
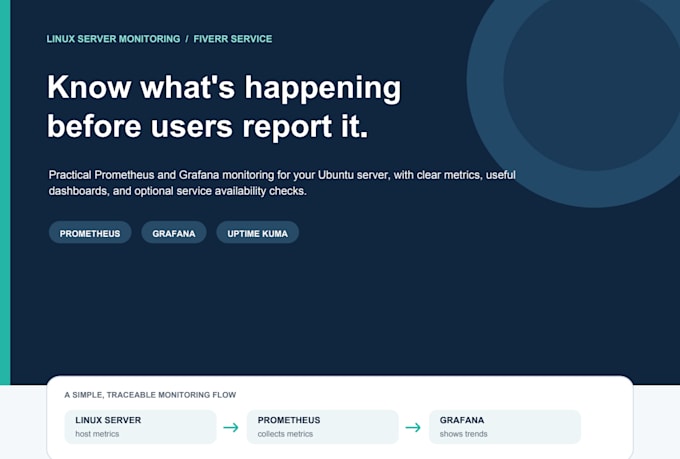
Want to see your infrastructure health before a problem affects users? I will set up Prometheus and Node Exporter to collect server metrics, then connect Grafana so you can view CPU, memory, disk, and network data in a clear dashboard.
Choose a package for metrics setup, a Grafana dashboard, or added Uptime Kuma checks for selected websites and services. You will receive a summary of the work and practical handover notes.
Packages cover one server or multiple clusters monitoring. Contact me before ordering for tailored orders.


Operating system:
Windows
•
Linux
•
Unix
•
Android
•
Vmware
Do packages include more than one server?
Yes
Will you configure alert notifications?
Basic alerts are covered. More specified alerts are available as per request
What access do you need?
An approved remote access method and a temporary account with only the permissions needed.
What will I receive?
The agreed setup, a summary of changes, and package-specific handover notes.
Can you customize the solution for my environment?
Yes. Monitoring solutions are tailored to match your business requirements